
Updated on February 12, 2020
The market may be making new highs, but not all stocks are impressing traders with record-high share prices. In fact, some of the most buzzed-about names on Wall Street are hitting 52-week lows and their price action could continue to fall.
Even though these stocks are struggling, they shouldn’t be ignored. From profiting from rebounds to investing in solid companies trading at a temporary discounts, these stocks still deserve your attention.
MarketClub’s Trade Triangle technology spots the beginning of bearish drops, helping members:
- find optimal short-position entries
- determine when to take profits
- know when to sit out and wait for the next bullish shift
We’ve used our member-only scan to find 5 low-riding stocks that could be worthy of your watchlist.
When these stocks turn around, members will see new green signals and a positive change in the Chart Analysis Score.
Aurora Cannabis, Inc (ACB)
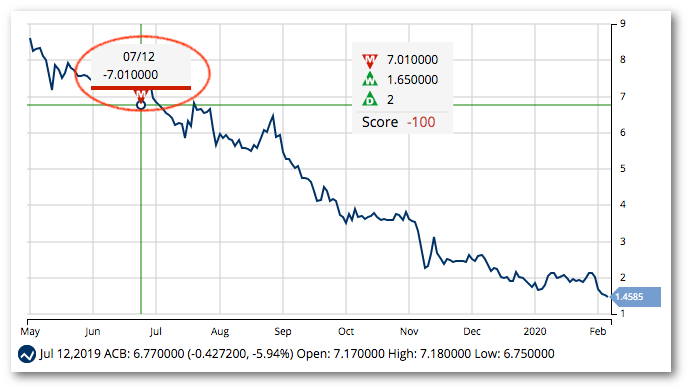
Aurora Cannabis, one of the most well-known cannabis stocks trading on a major exchange, has seen extreme weakness since hitting a 1-year high in March of 2019. The stock is now trading at levels not seen since early 2017.
Thankfully, the Trade Triangles warned members of a new long-term, bearish trend on July 17, 2019, at $7.01. Since that signal, ACB is down more than 75%.
With a -100 Chart Analysis Score, ACB is still within the confines of a strong downtrend. If and when this stock reverses AND establishes a firm uptrend, members will receive a new entry signal.
Trivago N.V. (TRVG)
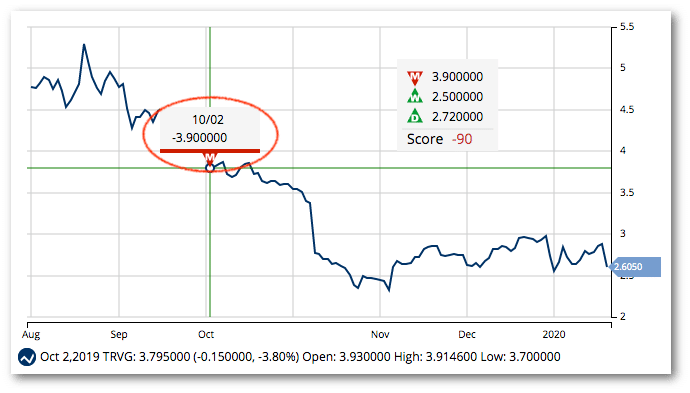
A Trade Triangle was issued for TRVG on October 2, 2019, at $3.90. This signal saved members from a 33% drop over the last four months.
In TRVG’s Q4 2019 earnings call, Managing Director and CEO, Axel Hefer, said that while the company is experiencing difficulties, they do have a clear plan to move forward. Litigation issues in Australia, marketing challenges, the coronavirus, and competition with major players like Google were all items that Trivago intends to address in 2020.
If Trivago manages to right the ship and the stock reverses its trend, members will see a positive change in the Chart Analysis Score and a new green signal.
Briggs & Stratton Corporation (BGG)
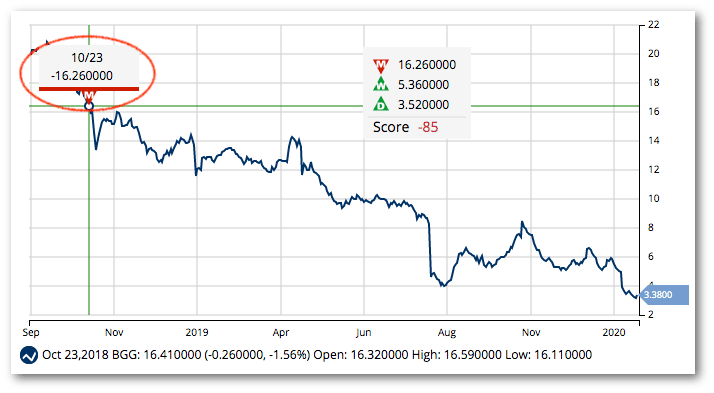
Briggs & Stratton, a company that manufactures, markets, sells, and services outdoor lawn equipment, has been in a 2-year freefall. BGG hit an all-time high of $27.34 on January 24, 2018, and hit an all-time low on February 11, 2020, at $3.13.
MarketClub members have been on the sidelines or in a short position since receiving a red signal on October 23, 2018, at $16.63. The stock has since fallen $13.50/share (81%) since that signal.
Insperity, Inc. (NSP)
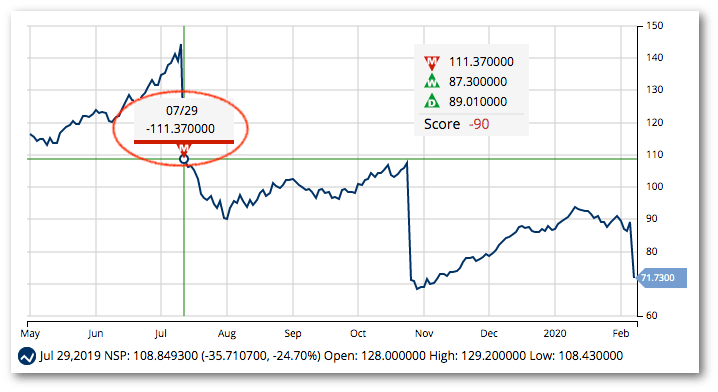
The chart for NSP is littered with a number of sharp drops after hitting an all-time high on July 26, 2019, at $144.92. Insperity, Inc., which provides human resources and business solutions for small to medium-sized companies, saw another massive fall after their Q4 2019 earnings call.
Insperity CEO, Paul Sarvadi, told shareholders that large and unexpected healthcare claims lead to earnings declines.
MarketClub members received a red Trade Triangle on July 29, 2019, at $111.37 and either took a short or sidelines position. The stock has since tumbled $39.64/share (35.5%). Members will look for a strengthening Chart Analysis Score or a new signal before entering NSP.
Vermilion Energy Inc. (VET)
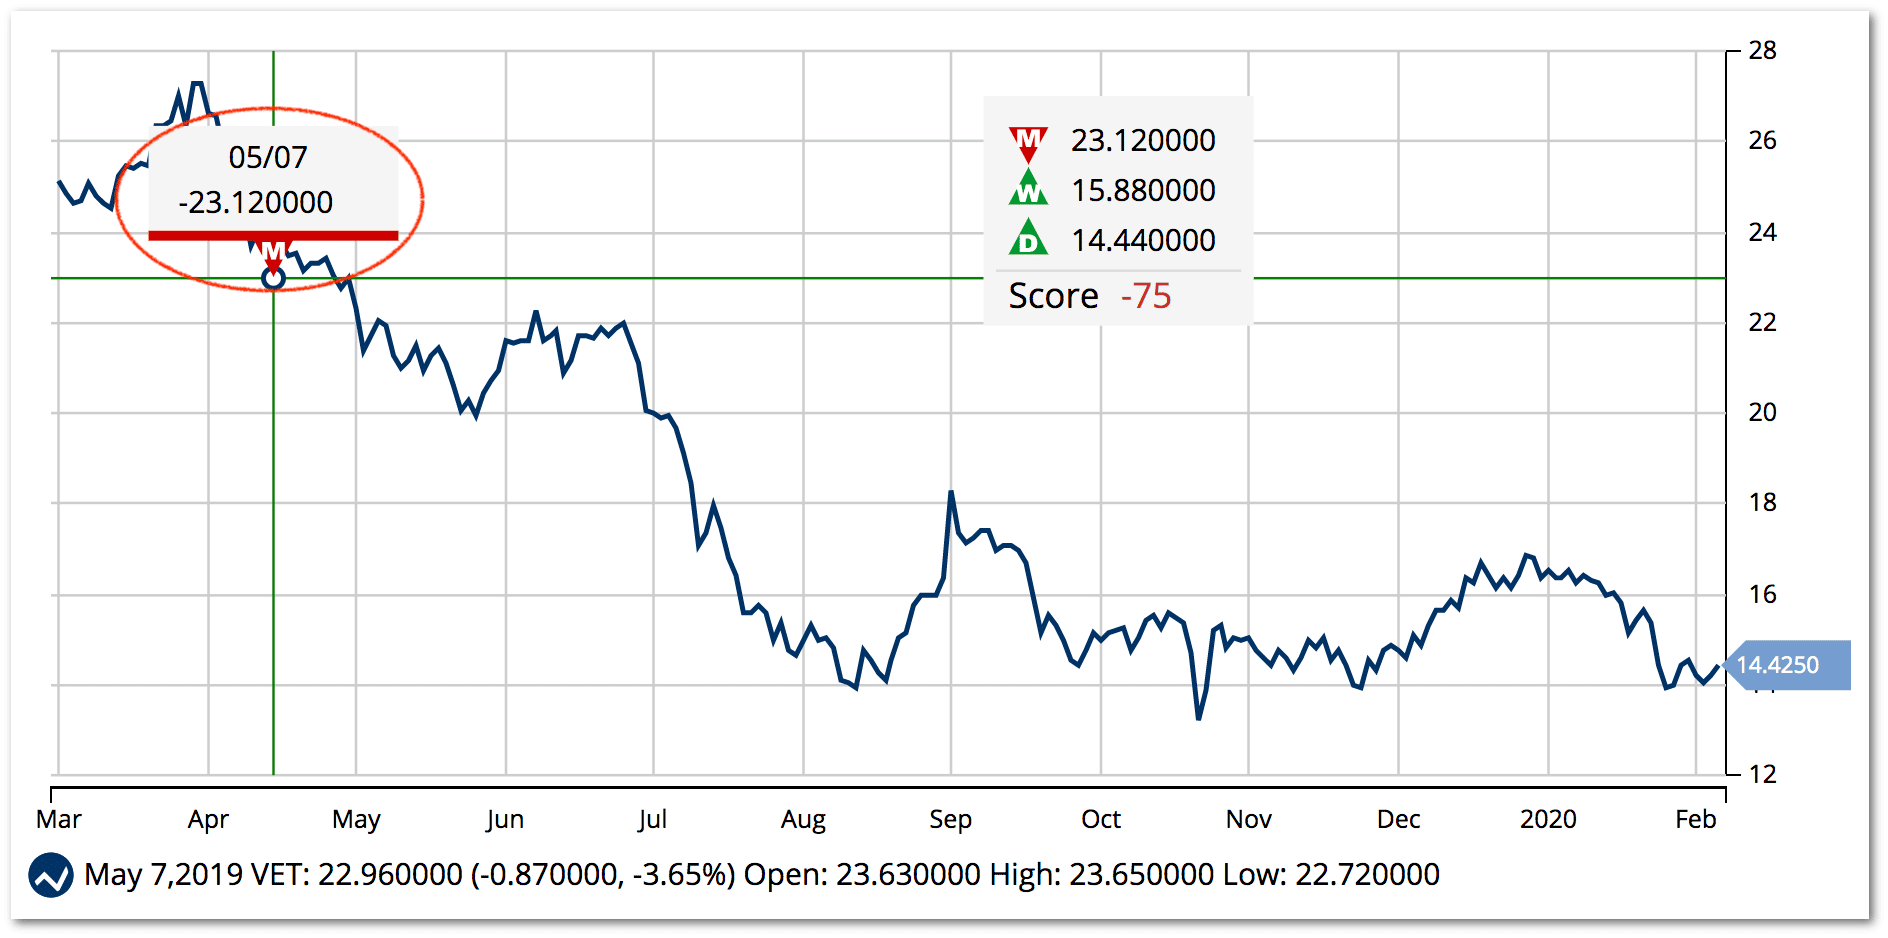
VET saw a steady rally since it’s public debut on 9/13/10. After hitting an all-time high on 6/16/14 at $72.19, the stock has moved down with a few short-lived moments of traction along the way.
This stock saw stabilization at the $25/share mark. However, our technology warned members on 5/7/19 at $23.12 of a bearish decline. Since this Trade Triangle was issued, VET fell another 40% and is now trading at the $14.50 level.
Don’t let these sharp stock declines scare you away.
While these stocks may continue their downward moves, our Smart Scan Score and Trade Triangle signals will detect signs of a bullish reversal for you!
Join MarketClub now and put our scans, alerts, and signaling tools to work.
