

The impact of the coronavirus has been mixed for some of the most heavily-traded stocks on Wall Street.
Since the middle of February, American Airlines Group Inc. (AAL) is down more than 60%, Starbucks Corporation (SBUX) has fallen more than 18%, and Yum! Brands, Inc. (YUM) has tumbled more than 20%.
However, a handful of stocks have reached all-time highs, demonstrating business models that survive and thrive in a stay-at-home economy.
On February 27, 2020, we covered five potential coronavirus-resistant stocks. These stocks had strong MarketClub ratings going into a time of mass quarantine orders.
What have these stocks done in the last 9 weeks? Four out of five of these stocks have made impressive moves through tough market conditions.
See the Trade Triangle signals and the long-term outlook for these five stocks going into May 2020.
Zoom Video Communications, Inc. (ZM)
Zoom is a video communications platform that allows people from all around the world to connect. Users can join a meeting from various devices for a number of professional, personal or educational purposes.
Avg. Volume: 13,746,927
Market Cap: 39.55B
Monthly Green Trade Triangle: 1/16/20 at $78.48
Smart Scan Score: +85
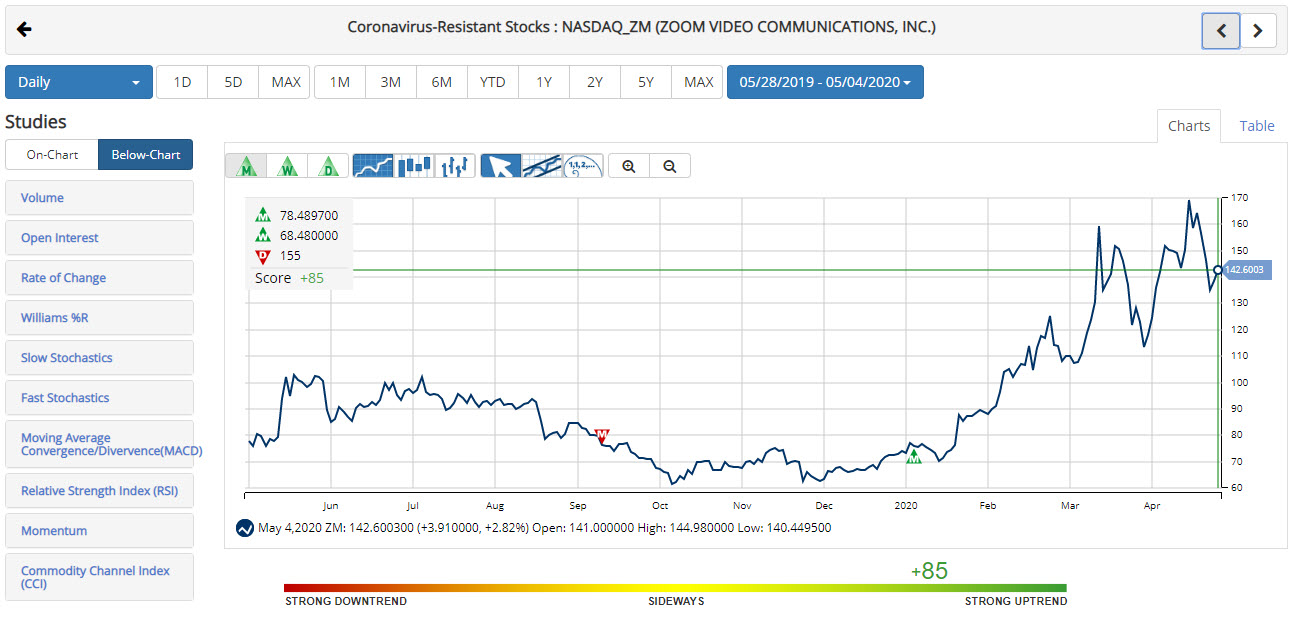
Zoom Video’s stock moved more than 30% since we highlighted this stock on February 27, 2020.
The stock has been in a strong uptrend since members received a monthly Trade Triangle on January 16, 2020, at $78.48. Zoom Video is up more than $64.12/share (81.7%). The stock continues to push higher despite the unsteady market sentiment.
Teladoc Health, Inc. (TDOC)
This virtual healthcare services company uses technology to connect patients with providers. Teledoc covers non-critical, chronic care, and other behavioral health services.
Avg. Volume: 3,534,970
Market Cap: 12.8B
Monthly Green Trade Triangle: 7/1/19 at $66.56
Smart Scan Score: +85
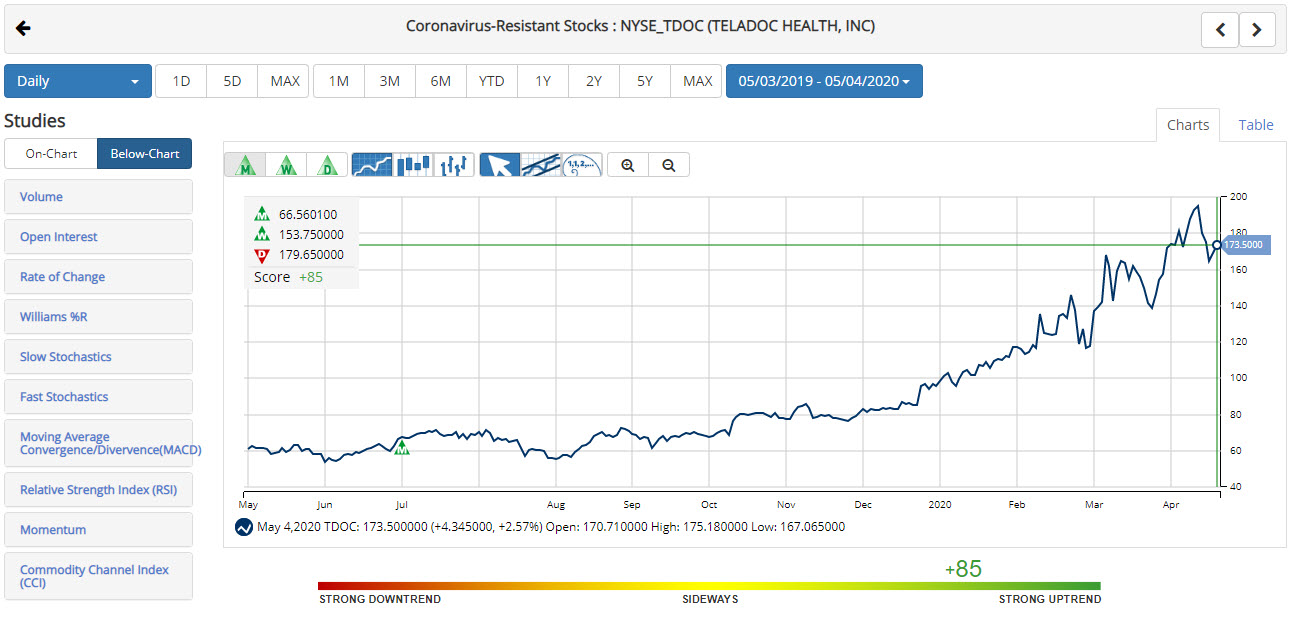
Teladoc is up more than 18% since our post.
TDOC has been been on a rocket up since members received a monthly Trade Triangle on July 1, 2019, at $66.56.
Since MarketClub’s last Trade Triangle signal, Teladoc’s stock is up $106.94/share (+160.6%). With a strong Chart Analysis Score and a solid demand for virtual health appointments, Teledoc Health, Inc. could continue to climb.
Cloudflare, Inc. (NET)
This cloud platform delivers a number of services to customers in the consumer, healthcare, sciences, and education industries among many others.
Avg. Volume: 3,348,691
Market Cap: 7.06B
Monthly Green Trade Triangle: 2/20/20 at $19.80
Smart Scan Score: +65
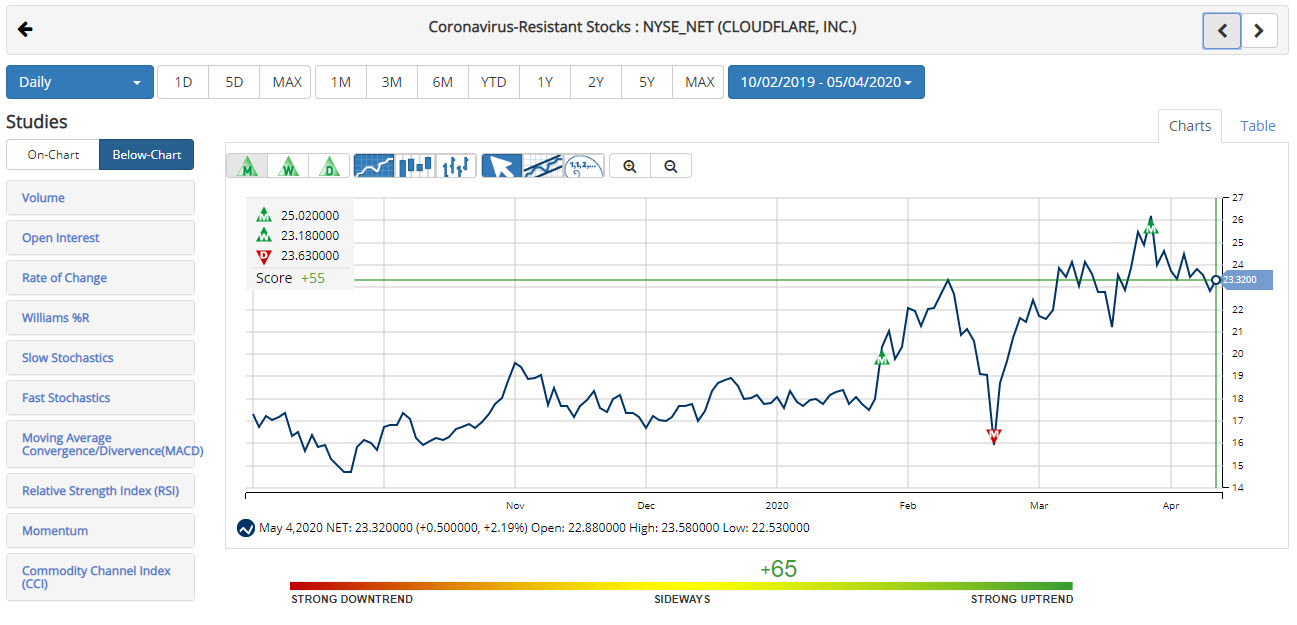
Cloudflare lost momentum in mid-March before triggering an exit signal.
NET began trading in October of 2019. After a move into the $17.25-$18.25 range in late 2019, the stock jumped to new highs in February 2020.
Members received a monthly Trade Triangle on February 20, 2020, at $19.80. NET jumped $5.22/share (26%) before losing momentum and dropping on May 6, 2020. As the Chart Analysis score fell, members would have looked to exit based on their money-management strategy. Momentum is fairly weak for NET. Members will look for the trend to strengthen before reconsidering this stock.
The Clorox Co. (CLX)
This well-known company manufactures and markets cleaning and household supplies. Their product lines include laundry additives, bleach, stain fighters, and disinfectants.
Avg. Volume: 2,596,440
Market Cap: 24.6B
Monthly Green Trade Triangle: 1/3/20 at $153.64
Smart Scan Score: +100
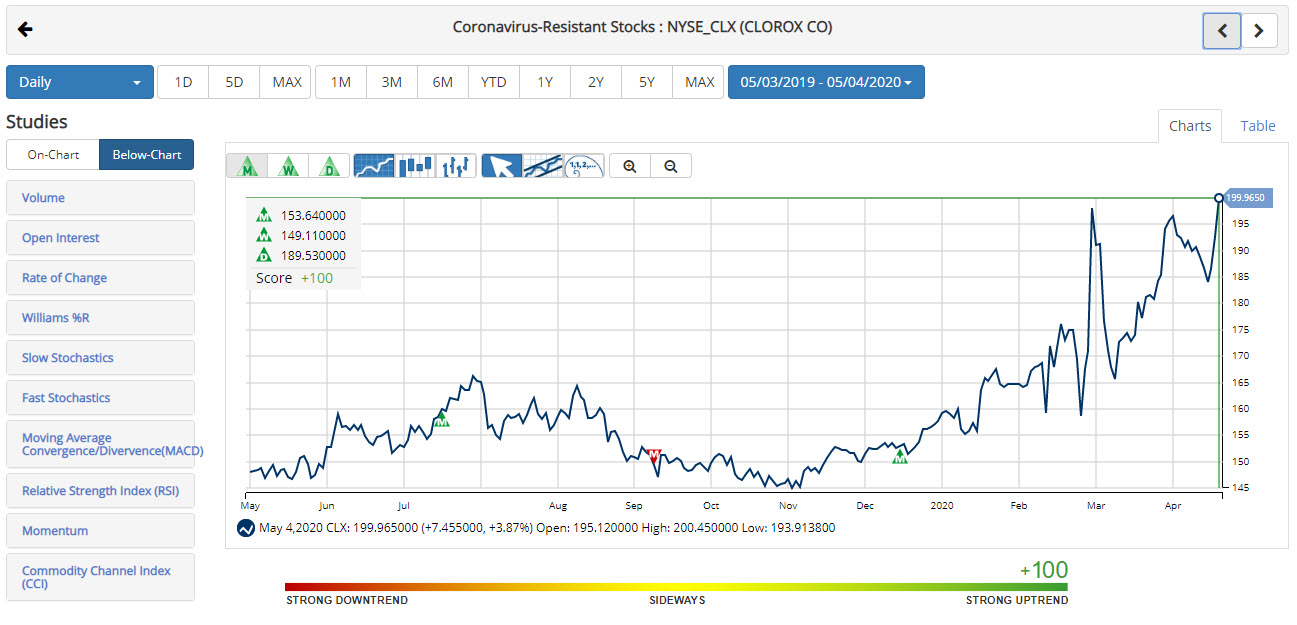
The Clorox Company’s momentum has slowed recently, but the stock has still jumped more than 17% since February 27, 2020.
After a choppy 2019, CLX began climbing at the start of the new year. MarketClub members received a green monthly Trade Triangle on the first trading day of the year at $153.64.
Since the change in the long-term trend, CLX has jumped an impressive $46.32/share (30%). With a Chart Analysis Score of +100, Clorox’s stock could keep climbing to new all-time highs.
Virtu Financial, Inc. (VIRT)
This company provides market-making services through its technology platform.
Avg. Volume: 1,446,106
Market Cap: 4.7B
Monthly Green Trade Triangle: 2/4/20 at $17.44
Smart Scan Score: +100
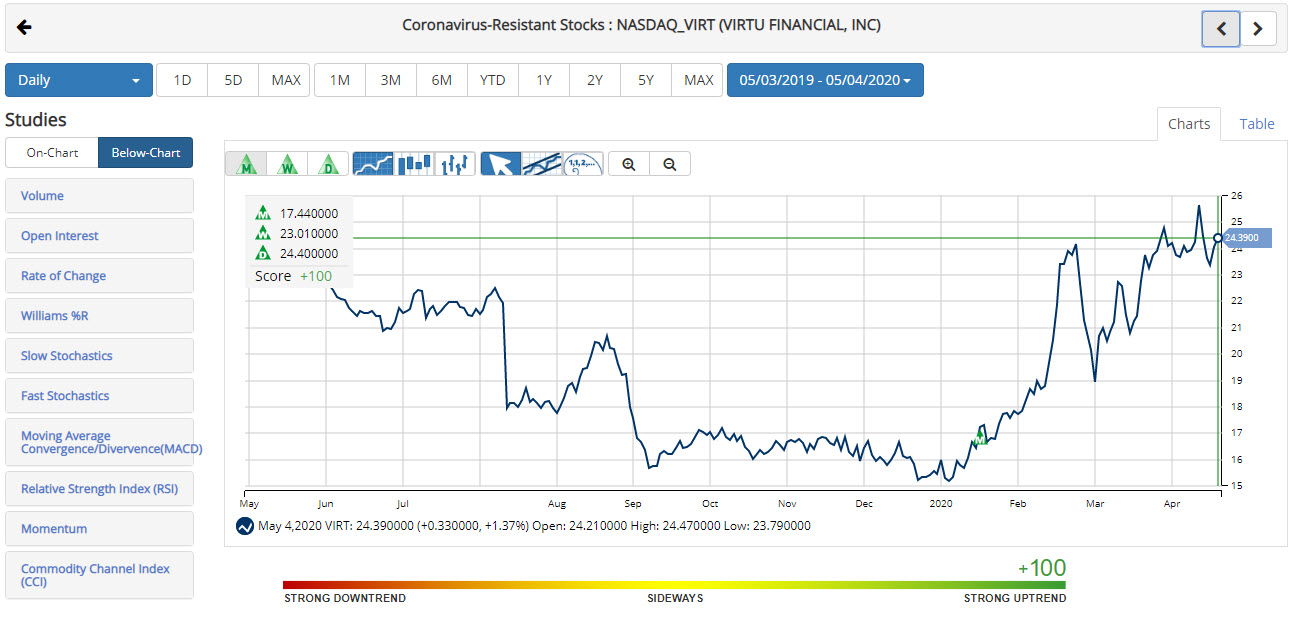
Virtu Financial continues to climb.
MarketClub detected a long-term trend change on February 4, 2020, at $17.44. Since issuing a green monthly Trade Triangle, VIRT has jumped $6.95/share (39%).
The Chart Analysis Score suggests that VIRT still has the technical support to continue its upward move. Members will be looking for a change in score or new signal to capture profits.
While the market is likely to see continued volatility, MarketClub members need not worry.
Our system never stops scanning over 350K symbols looking for trend shifts, warnings signs, and new opportunities.
Try MarketClub for the next 30 days, test our tools, and find new opportunities no matter which way the markets move!