
The markets continue to climb despite unrest in the streets of major U.S. cities, continued trade tension between the U.S. and China, further spread of COVID-19, and historic unemployment claims, among other issues.
Some analysts and high-level corporate executives, like Manolo Falco of Citigroup(C), believe that the markets will adjust to the reality of the pandemic. However, the Dow Jones Industrial Average just rebounded to the 26,000 point level, something not seen since early March.
These 5 stocks are showing strong, long-term bullish trends going into June 2020. While some stocks are still moving within the confines of their long-term trend, others have recently triggered new signals beginning a brand new bullish move.
Join MarketClub now to see the entry and exit signals for these stocks and thousands of others. You’ll also get access to our daily trade ideas, alerts, charts, and customizable portfolio manager.
Start Your 30-Day MarketClub Trial Now
Strongest Stocks for June 2020
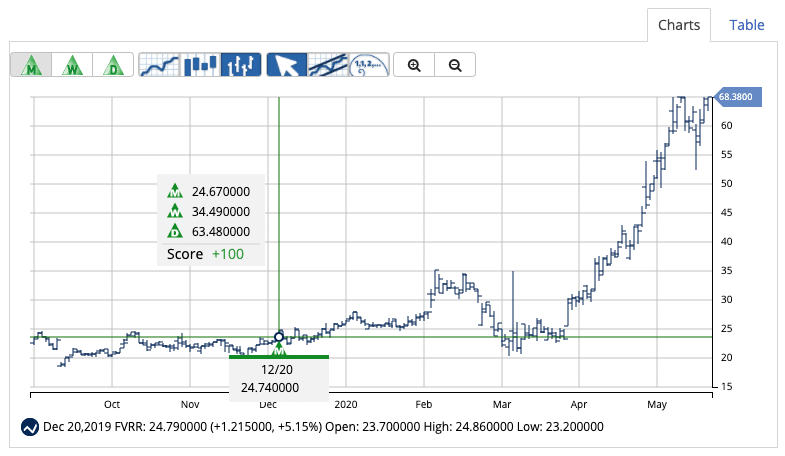
Fiverr International Ltd (FVRR)
This online market place allows gig workers to promote and sell their services. With eight verticals ranging from graphic design to programming, this service gives customers the back-end platform to create invoices and track and deliver project assets.
Avg. Volume: 613,557
Market Cap: 2.2B
Monthly Green Trade Triangle: 12/20/19 at $24.74
Smart Scan Score: +100
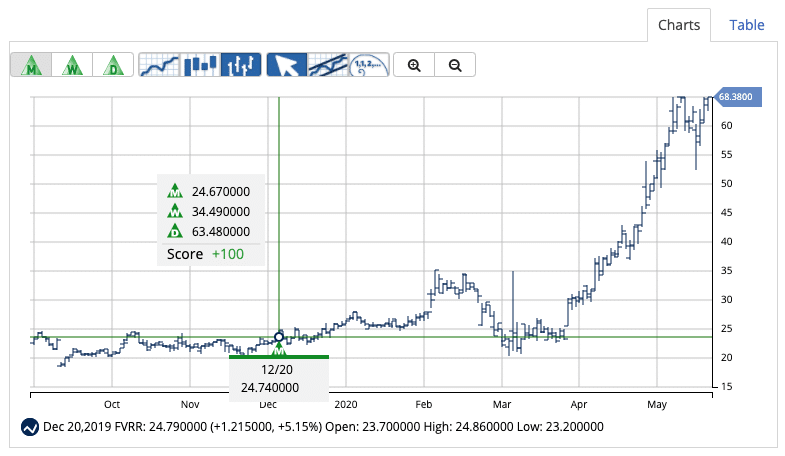
MarketClub members following the long-term strategy have been holding FVRR since December 12, 2019. After a new Trade Triangle was issued at $24.74, the stock’s price shot up taking members along with it.
As of the close on June 1, 2020, the stock is up more than 63% since the last signal.
With a Chart Analysis Score of +100, FVRR is still in a strong uptrend.
|
Discover Warren Buffett’s Secret Trading Tool Buffett quietly uses this trading tool to make billions on the side of his value-investing technique. Learn this secret trading tool and a strategy to place similar low-risk, high-profit potential trades. |
Overstock.com, Inc. (OSTK)
Overstock is a popular U.S. online retailer specializing in home decor and furniture. In 2018, Overstock launched a private label furniture brand and began offering 2-day shipping.
Avg. Volume: 3,504,282
Market Cap: 779M
Monthly Green Trade Triangle: 4/17/20 at $9.69
Smart Scan Score: +100
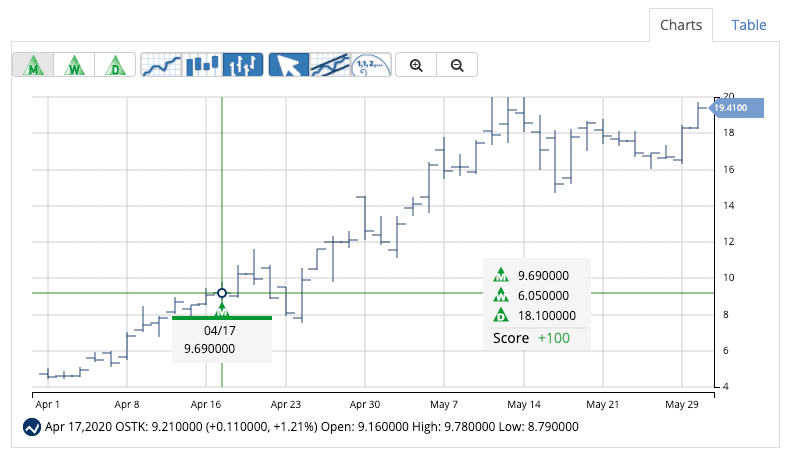
MarketClub members received a new green monthly Trade Triangle on April 17, 2020, at $9.69.
OSTK exploded up and moved into the confines of a long-term uptrend. As of the close on June 1, 2020, OSTK is up 49% since the monthly trading signal and is still showing major strength.
Tesla, Inc. (TSLA)
Tesla focuses on sustainable energy by developing, manufacturing, and selling electric cars, solar panels, and energy generating and storage systems.
Avg. Volume: 17,065,97
Market Cap: 166.4B
Monthly Green Trade Triangle: 10/24/19 at $266.07
Smart Scan Score: +100
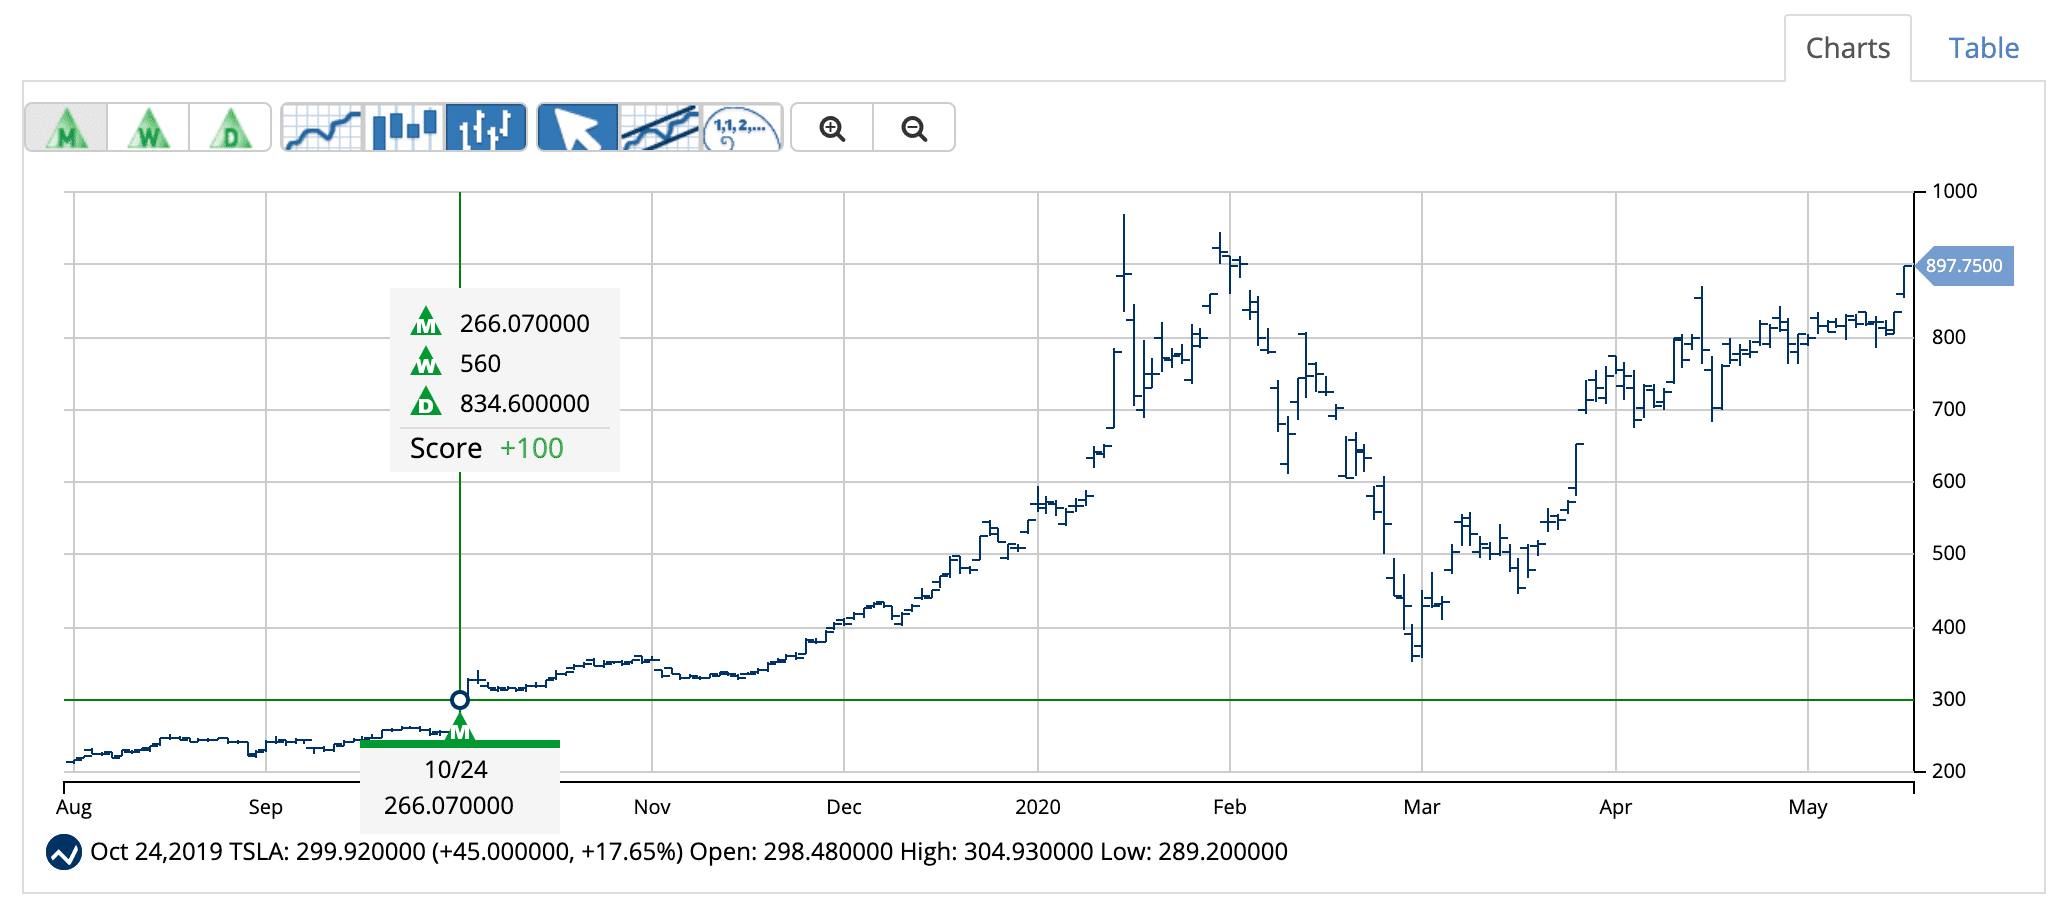
MarketClub members following the long-term strategy have been sitting in TSLA since receiving a green monthly Trade Triangle on October 24, 2019, at $266.07.
TSLA has moved up, now kissing the $900/share level. As of the close on June 1, 2020, members are hanging tight after a 70% move. The trend continues to hold technical strength and may continue a run higher.
Dropbox, Inc. (DBX)
Dropbox is a collaborative platform used by more than 600 million registered users in 180 countries. This company continues to beat analysts’ expectations and was just upgraded by RBC Captial to an “outperform” on May 8, 2020.
Avg. Volume: 6,025,123
Market Cap: 9.727B
Monthly Green Trade Triangle: 6/1/20 at $23.22
Smart Scan Score: +100
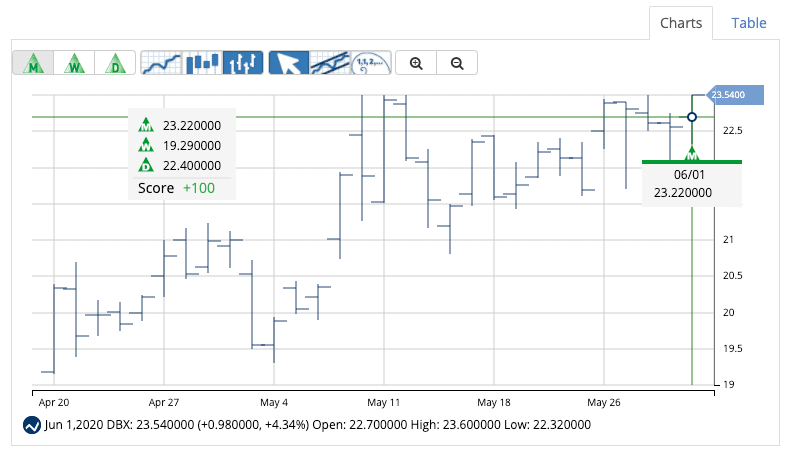
2020 has been good to Dropbox with the stock value moving slowly, but steadily into higher territory.
With a +100 Chart Analysis Score and a new monthly Trade Triangle issued on June 1, 2020, at $23.22, DBX could run higher. MarketClub members can continue to hold DBX until the trend weakens or until a new trading signal is issued.
AppFolio, Inc. (APPF)
Founded in 2006, AppFolio provides industry-specific business software solutions for real estate and legal companies. These full-service tools help streamline scheduling, marketing, and accounts receivable tasks.
Avg. Volume: 186,377
Market Cap: 5.548B
Monthly Green Trade Triangle: 5/26/20 at $148.07
Smart Scan Score: +100
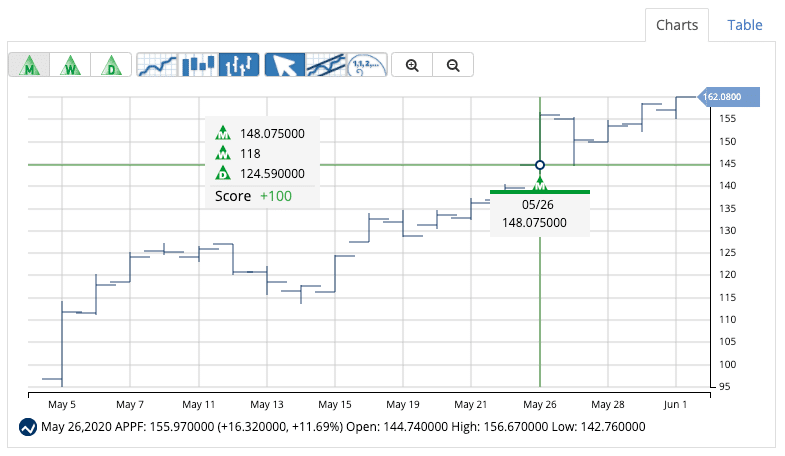
Appfolio traded below the $100 mark until the middle of 2019. However, APPF teased the $100/share mark before picking up steam in late 2019 and continuing the traction into 2020.
A new monthly green Trade Triangle was issued on May 26, 2020, at $148.07. As of the close on June 1, 2020, the stock is up 8.6%. The momentum looks steady for APPF and the Smart Scan Score suggests that there is more room to run.
Changes in price action and momentum may alter the outlook for these 5 stocks. This does NOT mean you should sit in front of your computer to monitor the action!
Let MarketClub carefully watch these stocks for you.
Begin your 30-day MarketClub trial right now to get the signals, alerts, and member-exclusive analysis for the hottest stocks, futures, ETFs, and forex pairs for June 2020 and beyond.