
With the election drawing closer, trader anxiety and volatility is running high.
Superstar stocks have lost their shine over the last month and a half.
For example, DexCom, Inc. (DXCM) jumped more than 100% in 2020 before hitting a YTD high of $455 on August 5, 2020. The stock has since dropped more than 11%.
NVIDIA Corporation (NVDA) has also tumbled a bit since rising over 143% this year. The stock dropped from $589 to $468 (20%) in 2 days. The stock has recovered but has yet to reestablish a firm intermediate-term trend.
An obvious COVID play, The Clorox Co. (CLX), sprang more than 54% from the beginning of the year to when it hit a high on August 4, 2020. The cleaning product manufacturer has fallen more than 8% since, stumbling to the $215 level.
While many high-volume equities are moving sideways as we approach November 3, 2020, a handful of stocks are trending lower and have the momentum to fall to all-time lows.
Stocks FALLing with Technical Bearish Trends
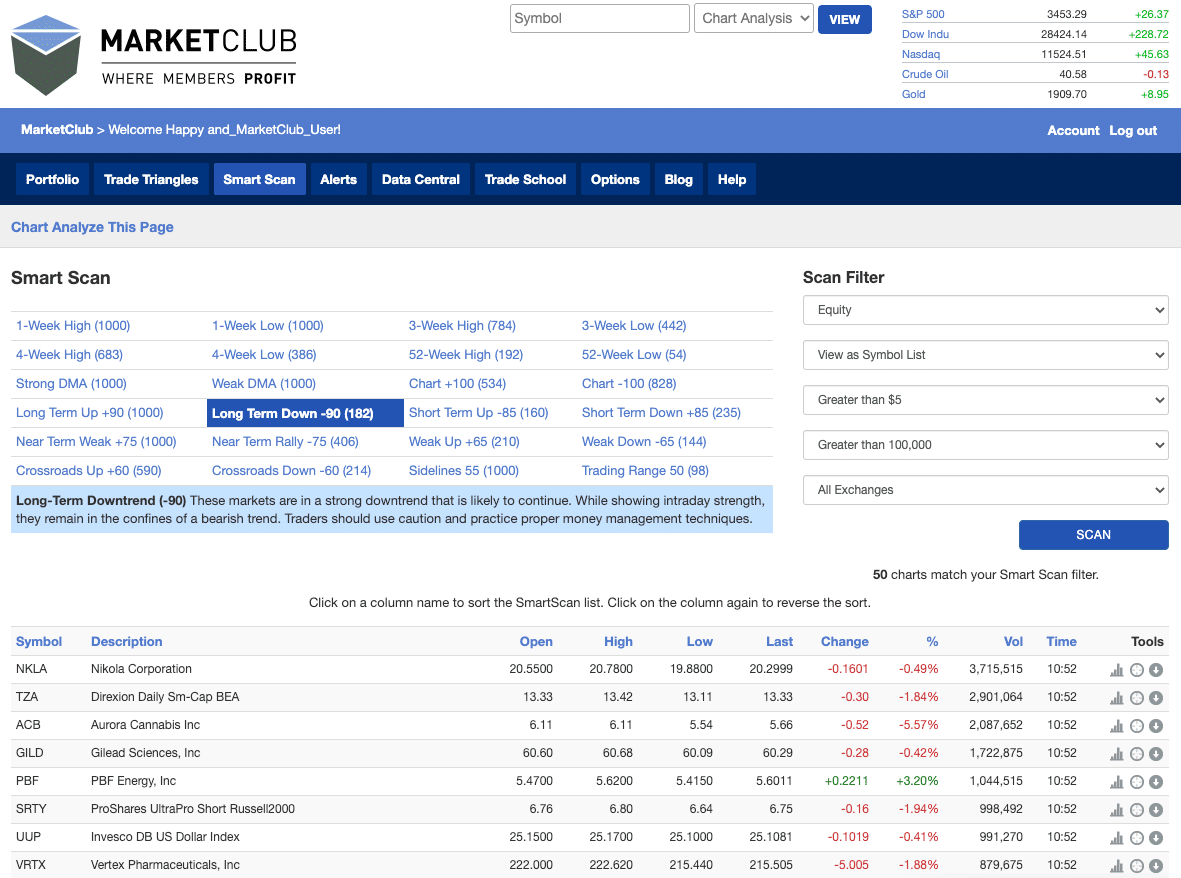
Using Smart Scan, MarketClub members can make up-to-the-minute lists of stocks (plus ETFs, futures, and forex pairs) that match specific technical patterns.
We filtered down the highest-volume, bearish stocks to create the list below.
This Long-Term Downtrend (-90) scan returns stocks with the markings of intermediate and long-term downtrends. At any time, members can rerun this scan for up-to-moment updates.
These are the falling stocks that have the momentum to hit lower lows.
Nikola Corporation (NASDAQ:NKLA)
The company operates as an integrated zero-emissions transportation systems provider. Nikola designs and manufactures battery-electric and hydrogen-electric vehicles, EV drivetrains, vehicle components, energy storage systems, and hydrogen fueling station infrastructure.
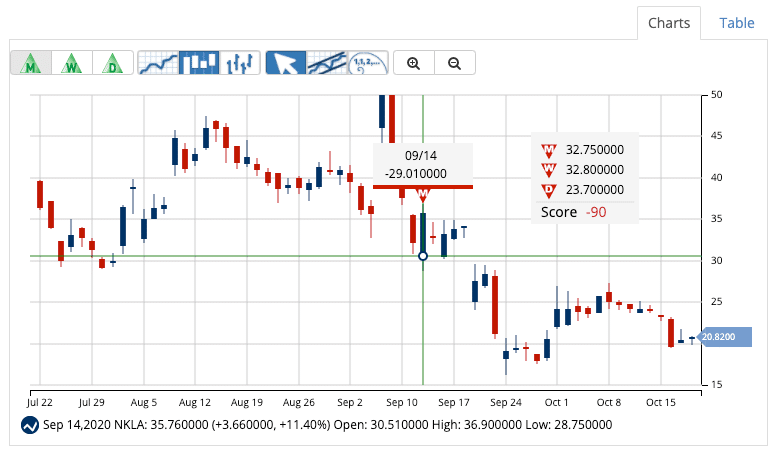
Nikola triggered a long-term, red Trade Triangle on September 14, 2020, at $29.01. As of October 20, 2020, the stock has fallen more than 28% since the signal and continues to have downward momentum.
Aurora Cannabis Inc (TSE:ACB)
Aurora Cannabis Inc. produces and distributes medical cannabis products worldwide. The company participates in facility engineering and design, cannabis breeding, genetics research, production, derivatives, high value-add product development, home cultivation, wholesale, and retail distribution.

Aurora was once thought to be one of the most promising cannabis stocks. However, the stock has been in a free fall since hitting an all-time high in late 2018. As of October 20, 2020, the stock is down more than 96% since October 17, 2018.
While it may appear that Aurora can’t go any lower, the technical trend analysis is pointing to a further move.
Gilead Sciences, Inc. (NASDAQ:GILD)
Gilead discovers, develops, and commercializes medicines in the areas of unmet medical needs in the United States, Europe, and internationally. The company also works with other pharmaceutical companies to develop and release medicines and immunotherapies.
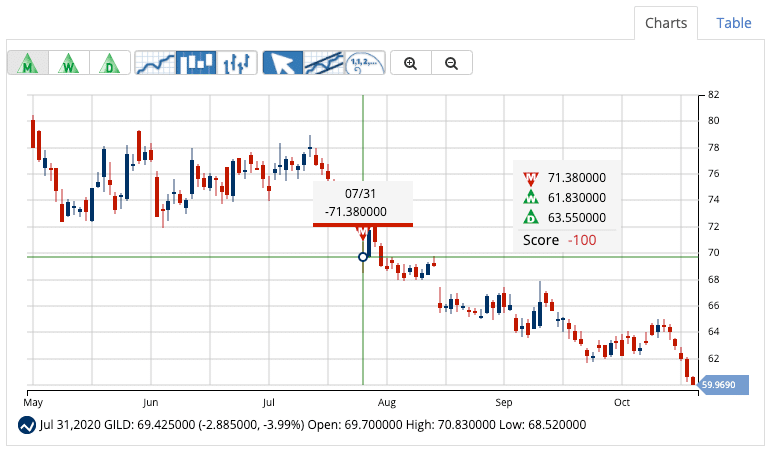
Gilead bounced around in the $70-80/share level for most of 2019. However, in July of 2020, the stock made a turn to the downside.
The stock triggered a red, monthly Trade Triangle on July 31, 2020, at $71.38 before making the descent to $59/share (down 17%), a price not seen since 2013.
GILD is still trending lower and a -100 Chart Analysis Score suggests that the price could continue to drop.
Vertex Pharmaceuticals, Inc. (NASDAQ:VRTX)
Vertex engages in developing and commercializing therapies for treating cystic fibrosis.
Vertex hit an all-time high on July 7, 2020, at $306.08. The stock made a steady ride down before gapping lower on October 15, 2020.
A red, monthly Trade Triangle warned members that a long-term downtrend was established on September 8, 2020, at $261.28. The stock has dropped more than 17.5% since that signal.
VRTX still has the technical markings of a bearish stock, and the price could continue to move lower.
PBF Energy, Inc. (NYSE:PBF)
This company produces gasoline, ultra-low-sulfur diesel, heating oil, diesel fuel, jet fuel, lubricants, petrochemicals, and asphalt, as well as unbranded transportation fuels, petrochemical feedstocks, blending components, and other petroleum products.
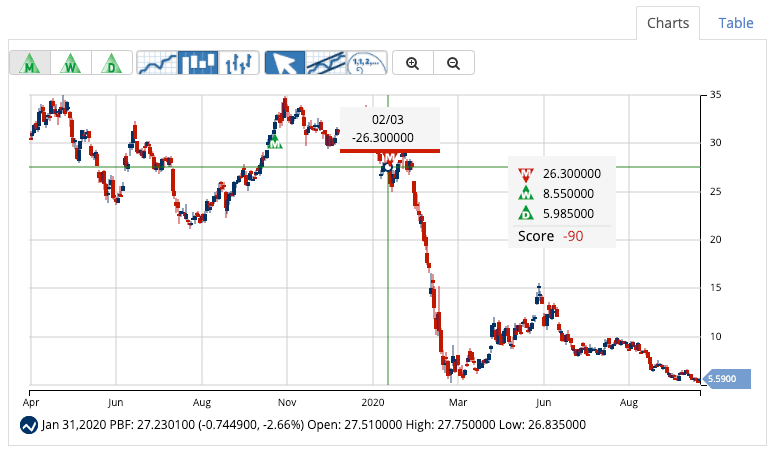
Like the border energy sector, PBF has experienced major weakness in 2020. After springing over the $50/share level this summer, the stock has been on a steady fall.
The last monthly, red Trade Triangle was issued on February 3, 2020, at $26.30. The stock has cratered another 78% and still has the markings of a further move lower.
Stocks can do three things – they can go up, they can go down, or they can move sideways.
Using MarketClub’s Smart Scan, members can create filtered lists of stocks, ETFs, futures, forex, and mutual funds that match a number of chart patterns to help predict future price action.
Ready to use Smart Scan? Sign up for a 30-day trial to MarketClub now!