Williams %R is a powerful technical analysis tool used to spot overbought and oversold conditions. This oscillator is just one of the 20+ technical analysis tools accessible to MarketClub members on our customizable charts. This momentum indicator, developed by Larry Williams, compares the current closing price to the high and low of a certain period,…
Tag: Technical Analysis
Beginner’s Guide to RSI
Relative Strength Index (RSI) is widely-used momentum oscillator measures the strength and speed of a market’s price movement by comparing the current price of the security against its past performance. Developed by J. Welles Wilder in the 1970s, the RSI can be used to identify overbought and oversold areas, support and resistance levels, and potential…
Beginner’s Guide to Moving Averages
Moving averages are one of the most popular technical studies. They are relatively simple to understand but can provide deep insight. Used alongside another indicator, like the Trade Triangles, the moving averages can be a great complementing tool. Moving averages are lagging indicators used to gauge the direction of the current trend. They smooth out the…
MarketClub’s On-Chart Studies
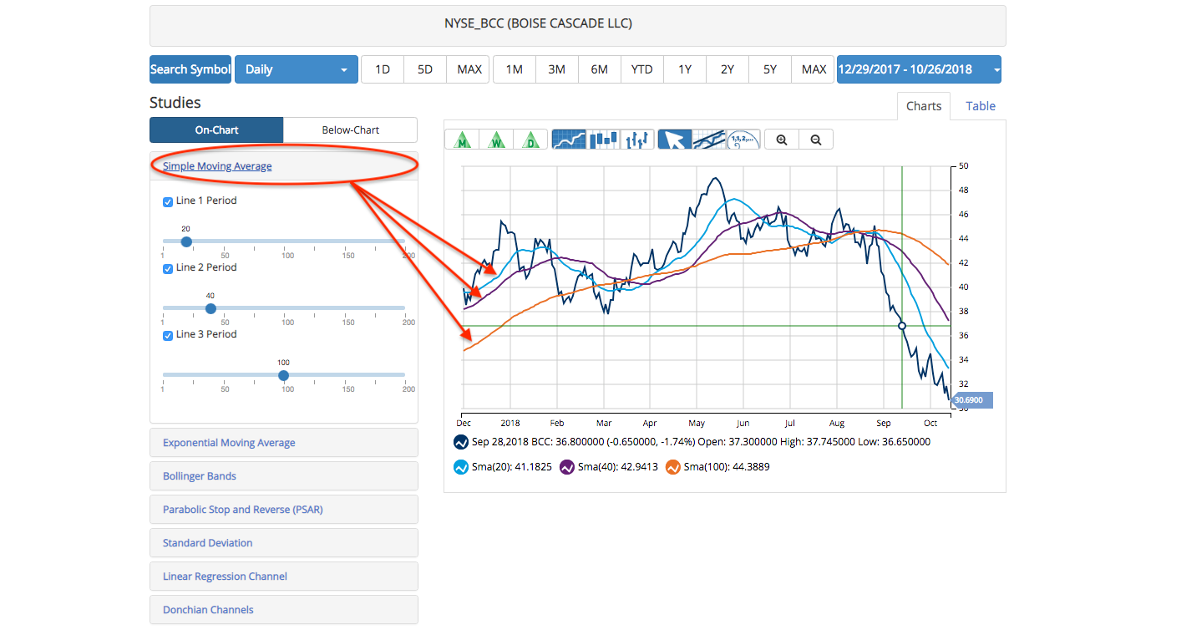
Simple Moving Average (SMA) – The simple moving average is found by calculating the sum of X periods and then dividing them by X periods. You can chart up to three simple moving averages. Make sure the box is checked for each separate SMA you would like. You can then slide the tab on the…
MarketClub’s Below-Chart Studies
Volume – Volume represents the number of shares or individual contracts traded during a given period of time. This indicator can be used to measure a movement’s worth. Changes in volume can be used to analyze liquidity and determine best execution fills. Rate of Change (ROC) – Rate of change represents the difference between the…


