Moving Average Convergence / Divergence (MACD) is one of the most popular studies for technical traders.
This trend-following, momentum indicator, developed in the late 70s by Gerald Appeal, shows the relationship between two moving averages.
Traders can use signal line crossovers, centerline crossovers, and positive and negative divergences to generate signals and spot changes in trend direction, strength, and momentum of a market.
How to Use the MACD
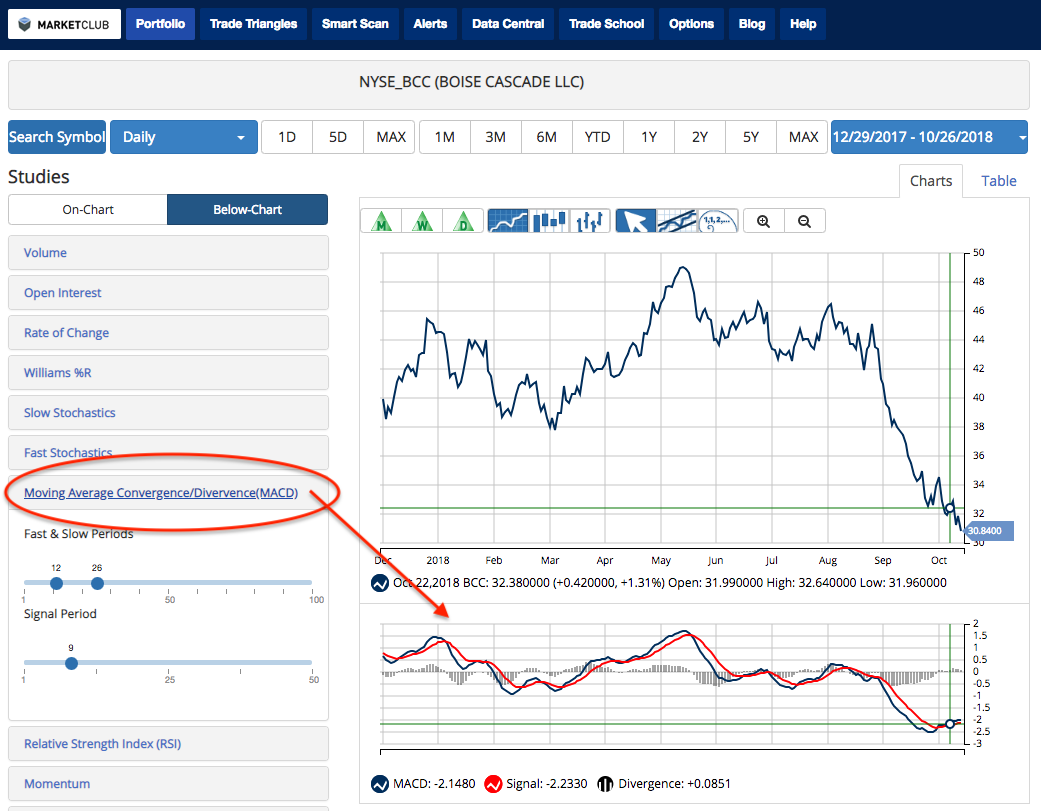
The indicator consists of a MACD line, a signal line, and a histogram. The MACD line is typically calculated as a 12-day Exponential Moving Average (EMA) minus a 26-day Exponential Moving Average (EMA). The signal line is typically calculated as a 9-day EMA of the MACD line. The difference between the MACD line and the signal line is represented by the histogram.
Signal Line Crossovers
Signal line crossovers are the most common usage of the MACD indicator. When the MACD line crosses above the signal line, it is viewed as a bullish crossover suggesting that the trend has turned up. When the MACD line falls below the Signal line, it could be viewed as a bearish crossover, suggesting the trend has turned down.
Since the Histogram shows the difference between the MACD line and the signal line, a trader can see the crossover represented by zero on the histogram. It can also help identify when the two lines are approaching a crossover. When the histogram narrows, a crossover could be approaching and when the Histogram widens, the current trend could be gaining strength.
Centerline Crossovers
Centerline crossovers can indicate to traders that the direction of the trend has changed. When the MACD line moves above centerline (zero) and the values are positive, it could mean upside momentum is increasing. This happens when the 12-day EMA moves above the 26-day EMA. When the MACD line falls below the centerline (zero) and the values are negative, it could mean downside momentum is increasing. This happens when the 12-day EMA moves below the 26-day EMA.
Positive and Negative Divergences
Divergences occur when the MACD diverges from the security’s price action and can signal the end of the current trend. A negative divergence takes place when the price of a security reaches a higher high in an uptrend, but the MACD weakens and records a lower high, suggesting less upside momentum. A positive divergence takes place when the price of a security reaches a lower low in a downtrend, but the MACD strengthens and records a higher low, suggesting less downside momentum.
MarketClub members can find this study in the Below-Chart Studies list in your customizable charts. Join MarketClub to test our charts and use the MACD.