
MarketClub members have access to over 20 technical analysis studies, including Bolling Bands.
While most members are here for our Trade Triangle Technology, they also have access to the most popular technical indicators.
What Are Bollinger Bands?
Developed in the 1980s by John Bollinger, Bollinger Bands is a technical analysis tool that illustrates volatility and determines overbought or oversold market conditions.
Comprised of a simple moving average (SMA) and two lines of standard deviations, the lines of the study sandwich the chart’s price action.
One of the most popular technical indicators, Bollinger Bands are easy to read and alert of significant price action moves.
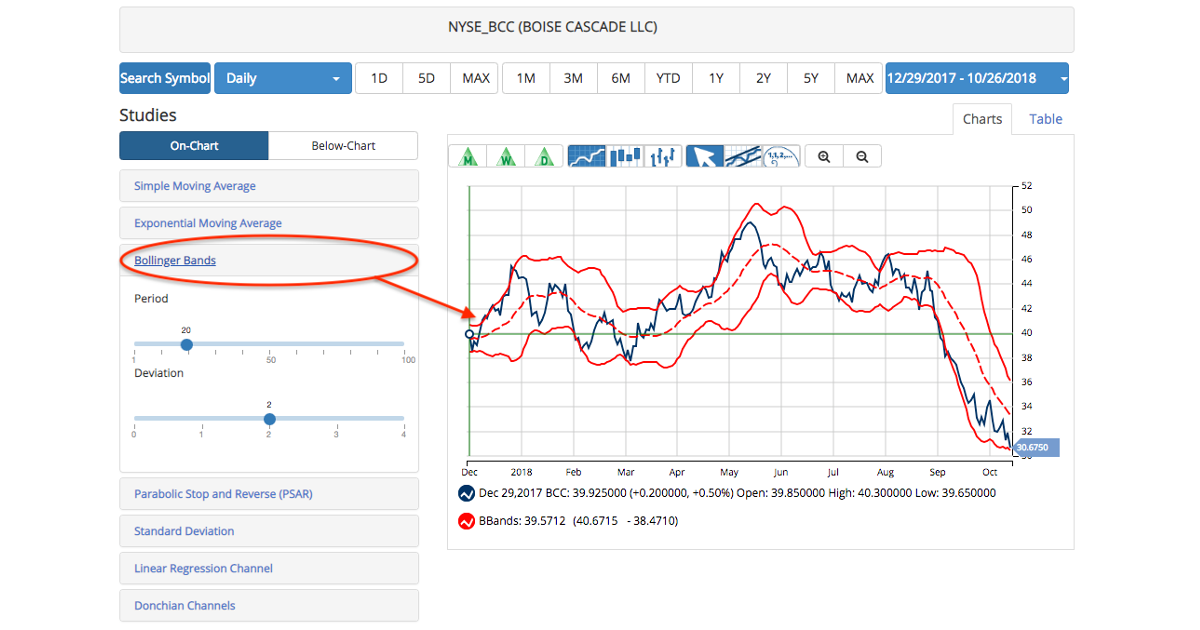
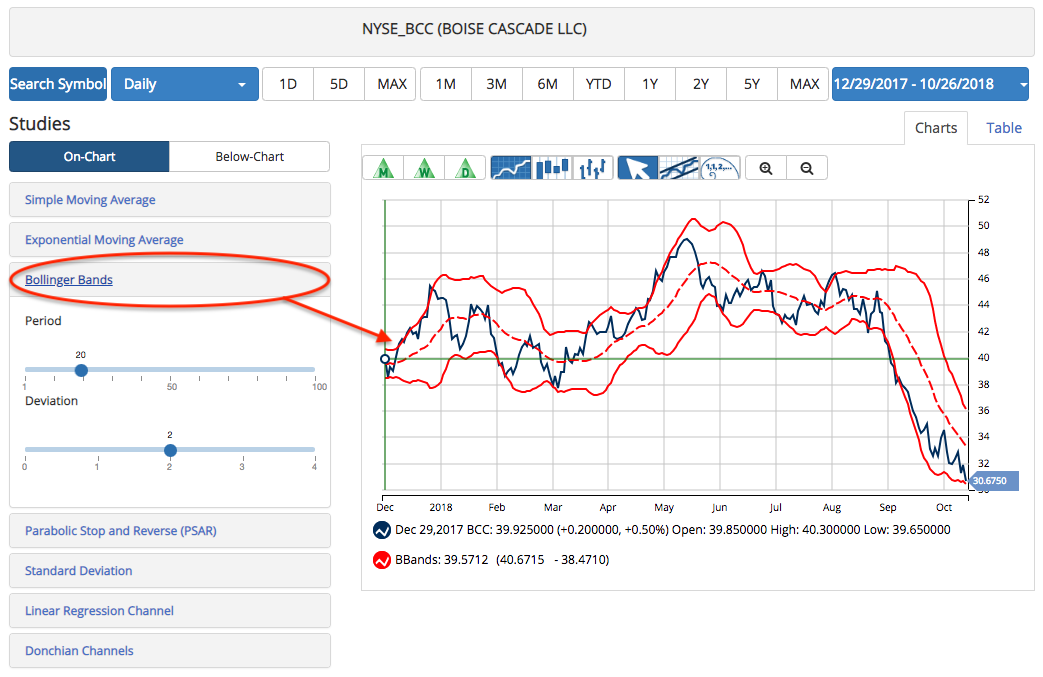
How to Chart the Bollinger Bands
The Bollinger Bands are made up of a set of three bands plotted in relation to the security’s price action.
The middle band is typically a simple moving average set at 20 periods.
Traders typically set the upper and lower bands at two standard deviations above and below the middle band.
Pinches & Gaps
It is believed that periods of high volatility often follow by periods of low volatility.
As a result, if price action becomes more volatile the bands will widen.
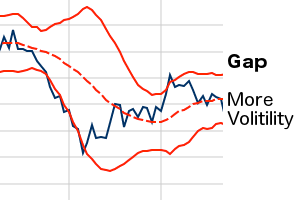
On the other hand, if volatility decreases, the bands will contract and move closer to the middle band.
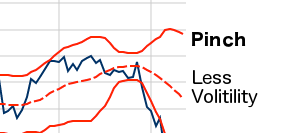
Traders may expect future periods of higher volatility if the bands pinch together. Conversely, traders may see price action move into a trading range with decreased volatility if they see a gap between the outer bands.
W-Bottoms And M-Tops
Bollinger Bands can identify W-Bottoms and M-Tops and helps to determine the strength of a trend.
Arthur Merrill, the author of Behaviors of Prices on Wall Street, identified 16 classic chart patterns with a basic W shape and 16 classic chart patterns with a basic M shape. Bollinger Bands can spot these patterns.
If the Bollinger Bands confirm a W-Bottom or M-Top, it could signify a potential break out and possible trend reversal.
Overbought And Oversold
According to Bollinger, the bands should contain a majority of the price action. Therefore, price moves outside of the outer bands should be considered significant.
Generally, as the price moves closer to or breaks through the upper band, the market could be considered overbought. On the contrary, as the price moves down to or breaks through the lower band, the market could be considered oversold.
Bollinger Band Recap
- Easy to read and popular indicator
- Can identify oversold and overbought conditions
- Price action outside of the bands can alert of significant moves
- Calculated using a 20-period simple moving average for the middle line and then +2 and -2 standard deviation for the top and bottom line.
MarketClub members can find this study in the On-Chart list in your customizable charts. Join MarketClub to test our charts and use the Bollinger Bands.
Post updated July 13, 2021.