
Stock screeners, like MarketClub’s Smart Scan, are a crucial tool for any technical trader.
Not only do they help you avoid thousands of undesirable markets, but they can quickly spot important technical setups that would have otherwise gone unseen.
Using screeners to spot stocks on the verge of a breakout is easy with MarketClub. This short video below will show you how to create a breakout watchlist with our Smart Scan screener and profit from stocks ready to pop.
What is a Breakout?
Breakouts exist in all markets and in almost all market conditions. The beginning of a breakout is the start of an upward or downward price swing and a notable occurrence for traders.
Long-positioned traders look for a stock to rise above its resistance level. When combined with a change in trading volume, the stock can make a very quick bullish move.
On the other hand, short-positioned traders look for a stock to fall below its resistance level. When this occurs, the stock’s price can fall rapidly.
How to Find Breakout Trades
Our Sidelines (+55) Scan looks for markets that are waiting for a trend to develop. The price action is often stuck between a thin layer of support and resistance as the stock consolidates.
MarketClub’s Sidelines Scan looks for markets (stocks, ETFs, futures, or forex) that are showing slight (but noticeable) signs of a strengthening momentum. If the stock continues its move and breaks through one of these barriers, the score will increase, indicating short-term strength and the beginning of a new trend.
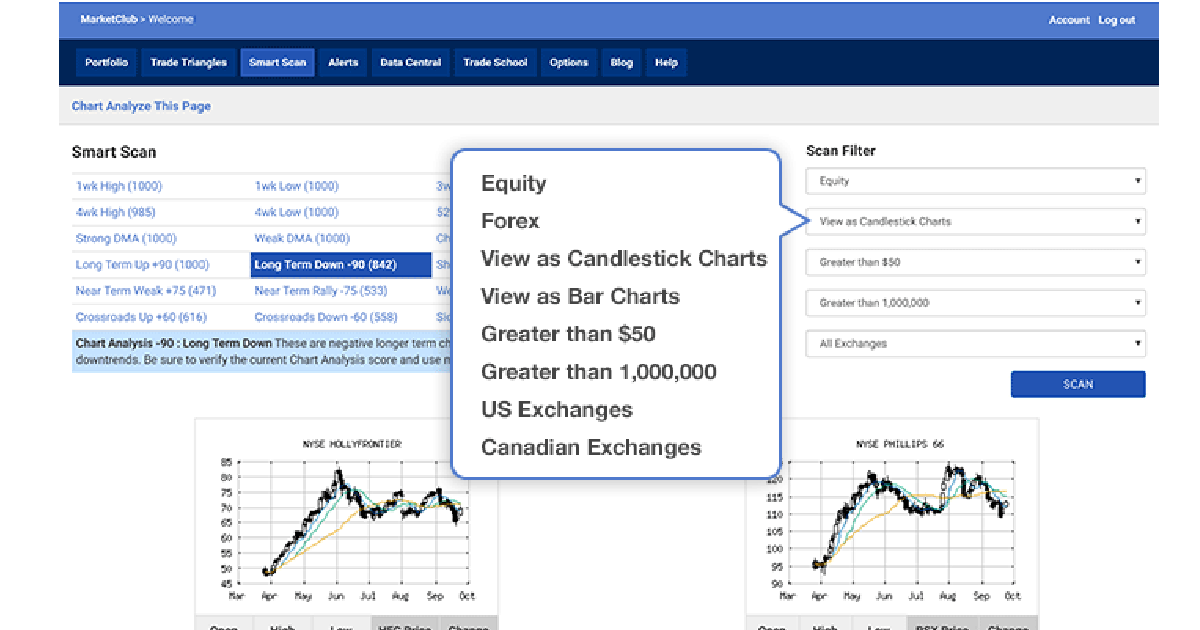
Suggested Filters for Sidelines (+55) Scan
- Select “Sidelines 55” from the scan list.
- Set Filters
- Equity
- View as Line Chart
- Price Greater Than $20
- Volume Greater Than 2,000,000
- U.S. Exchanges
- Hit SCAN
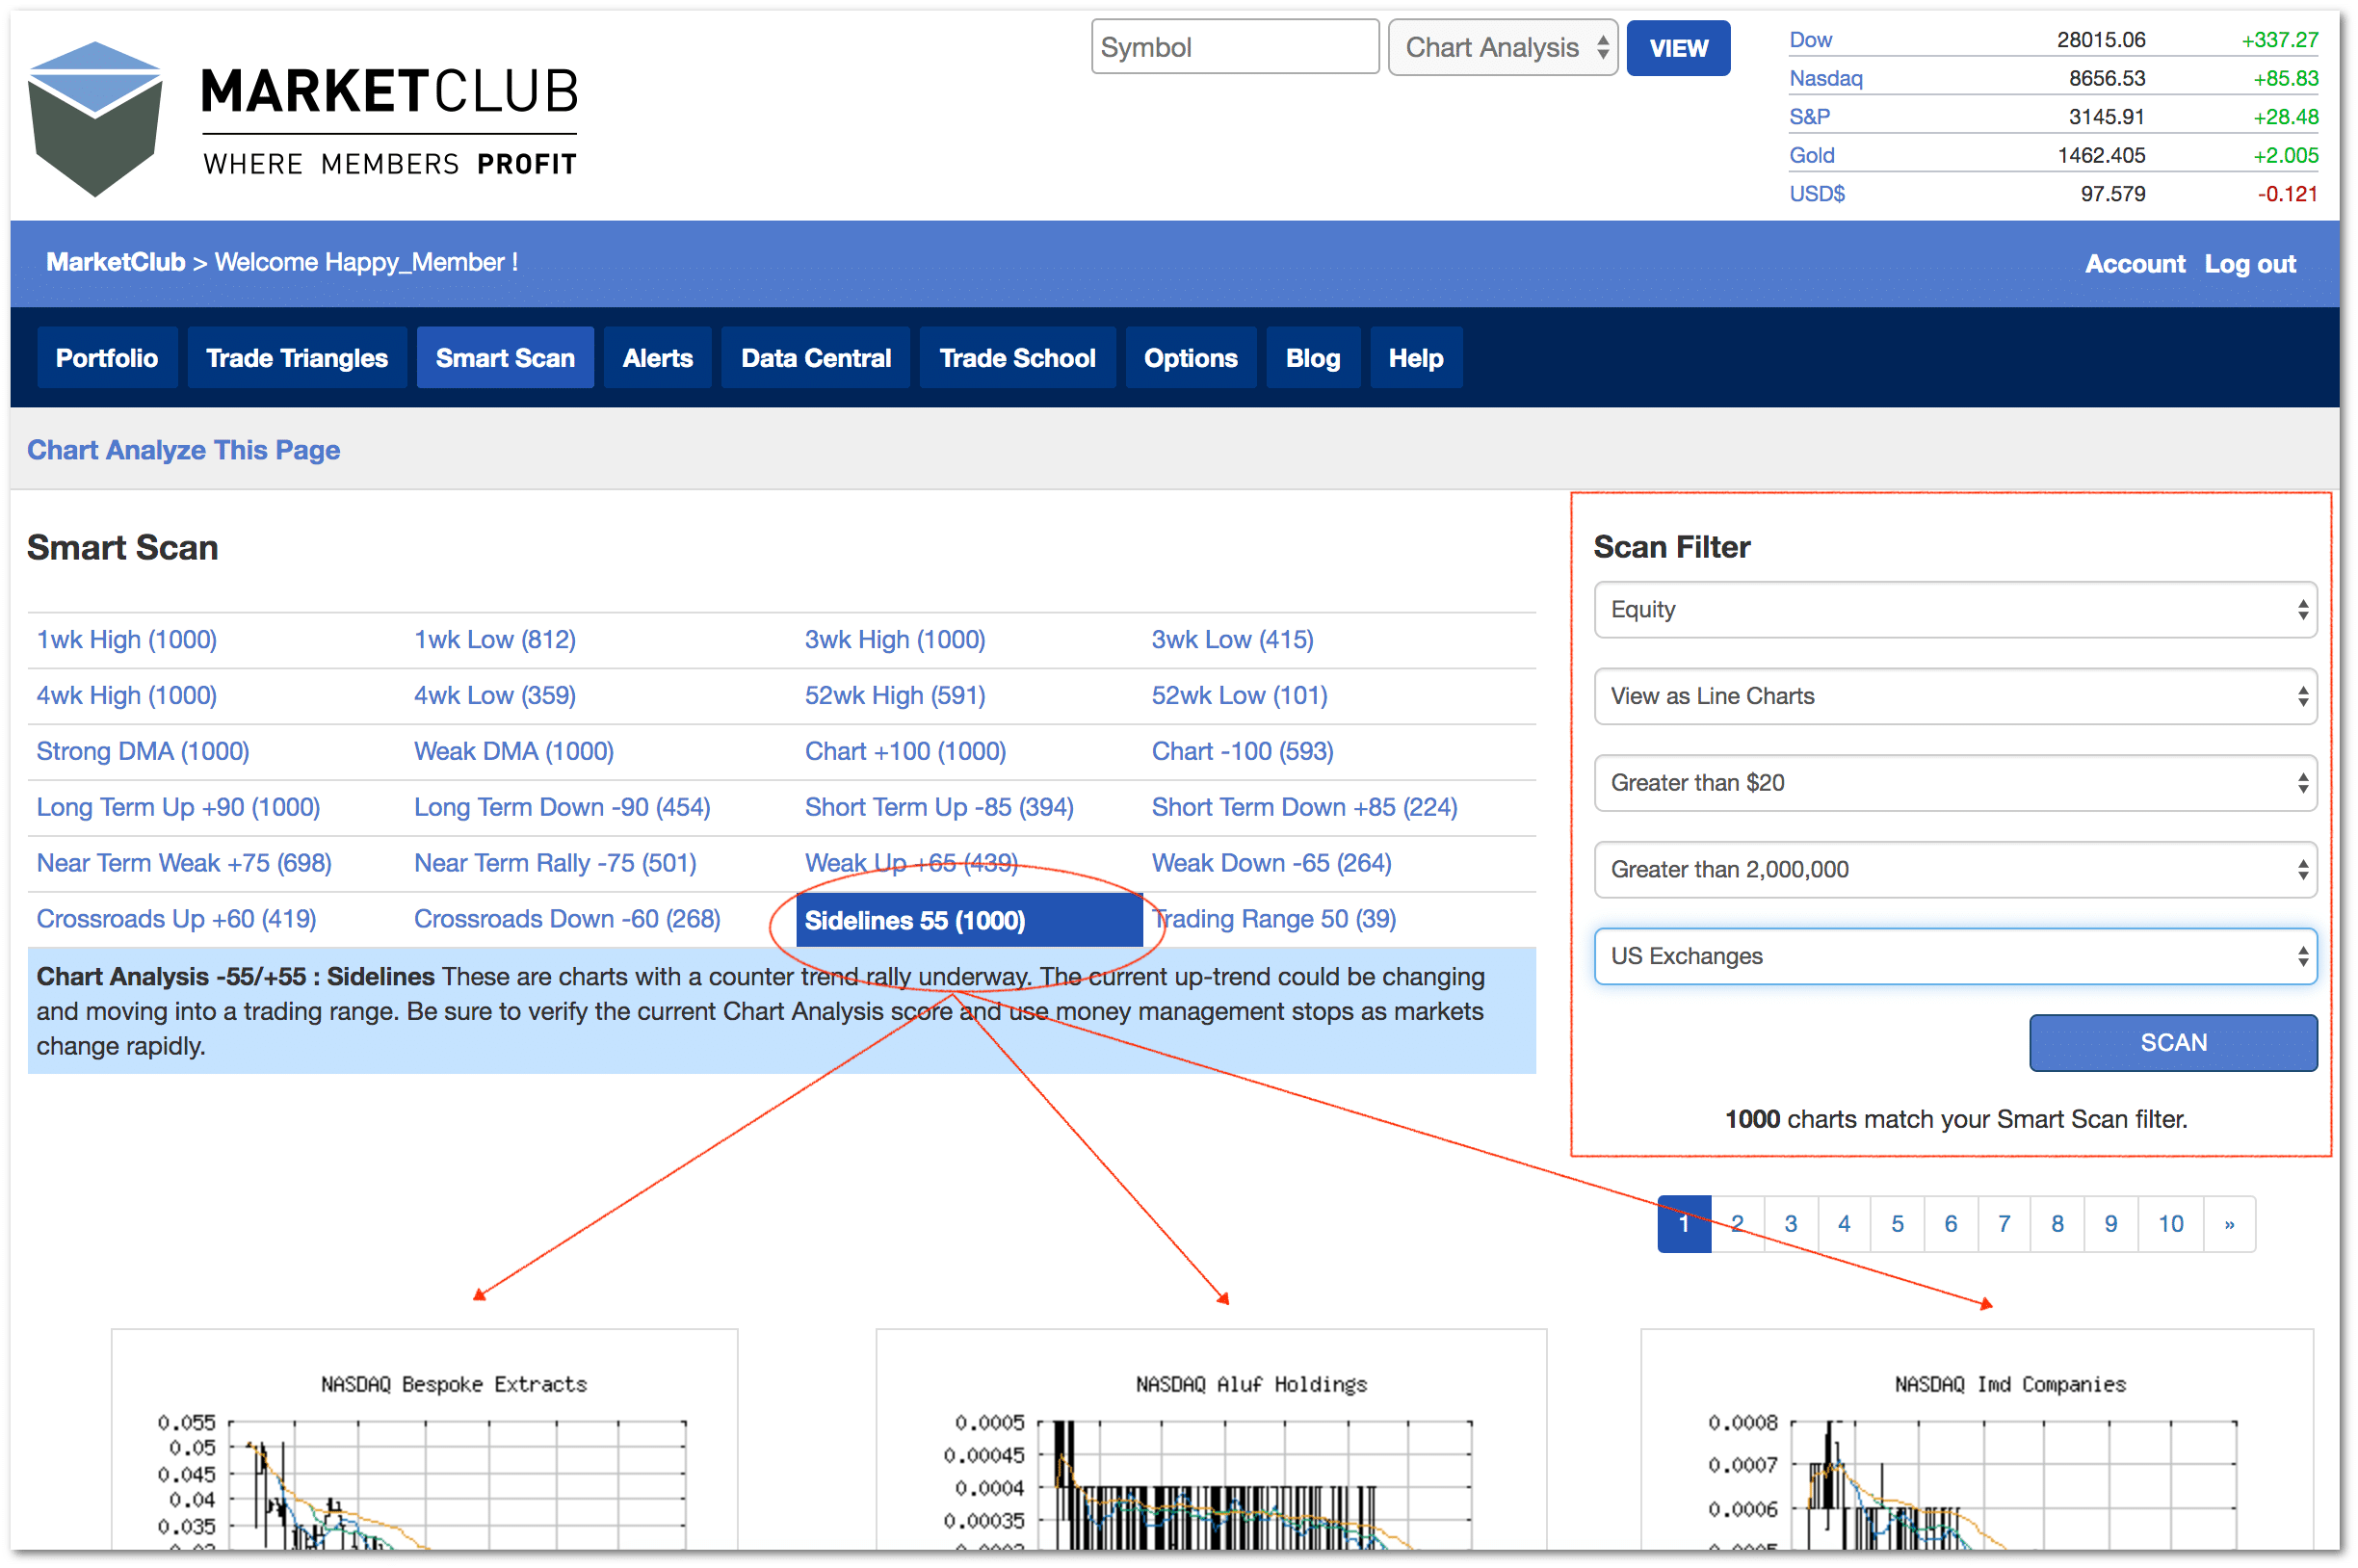
MarketClub’s Smart Scan will crank out a condensed list of potential breakout stocks with charts that match your technical scan criteria.
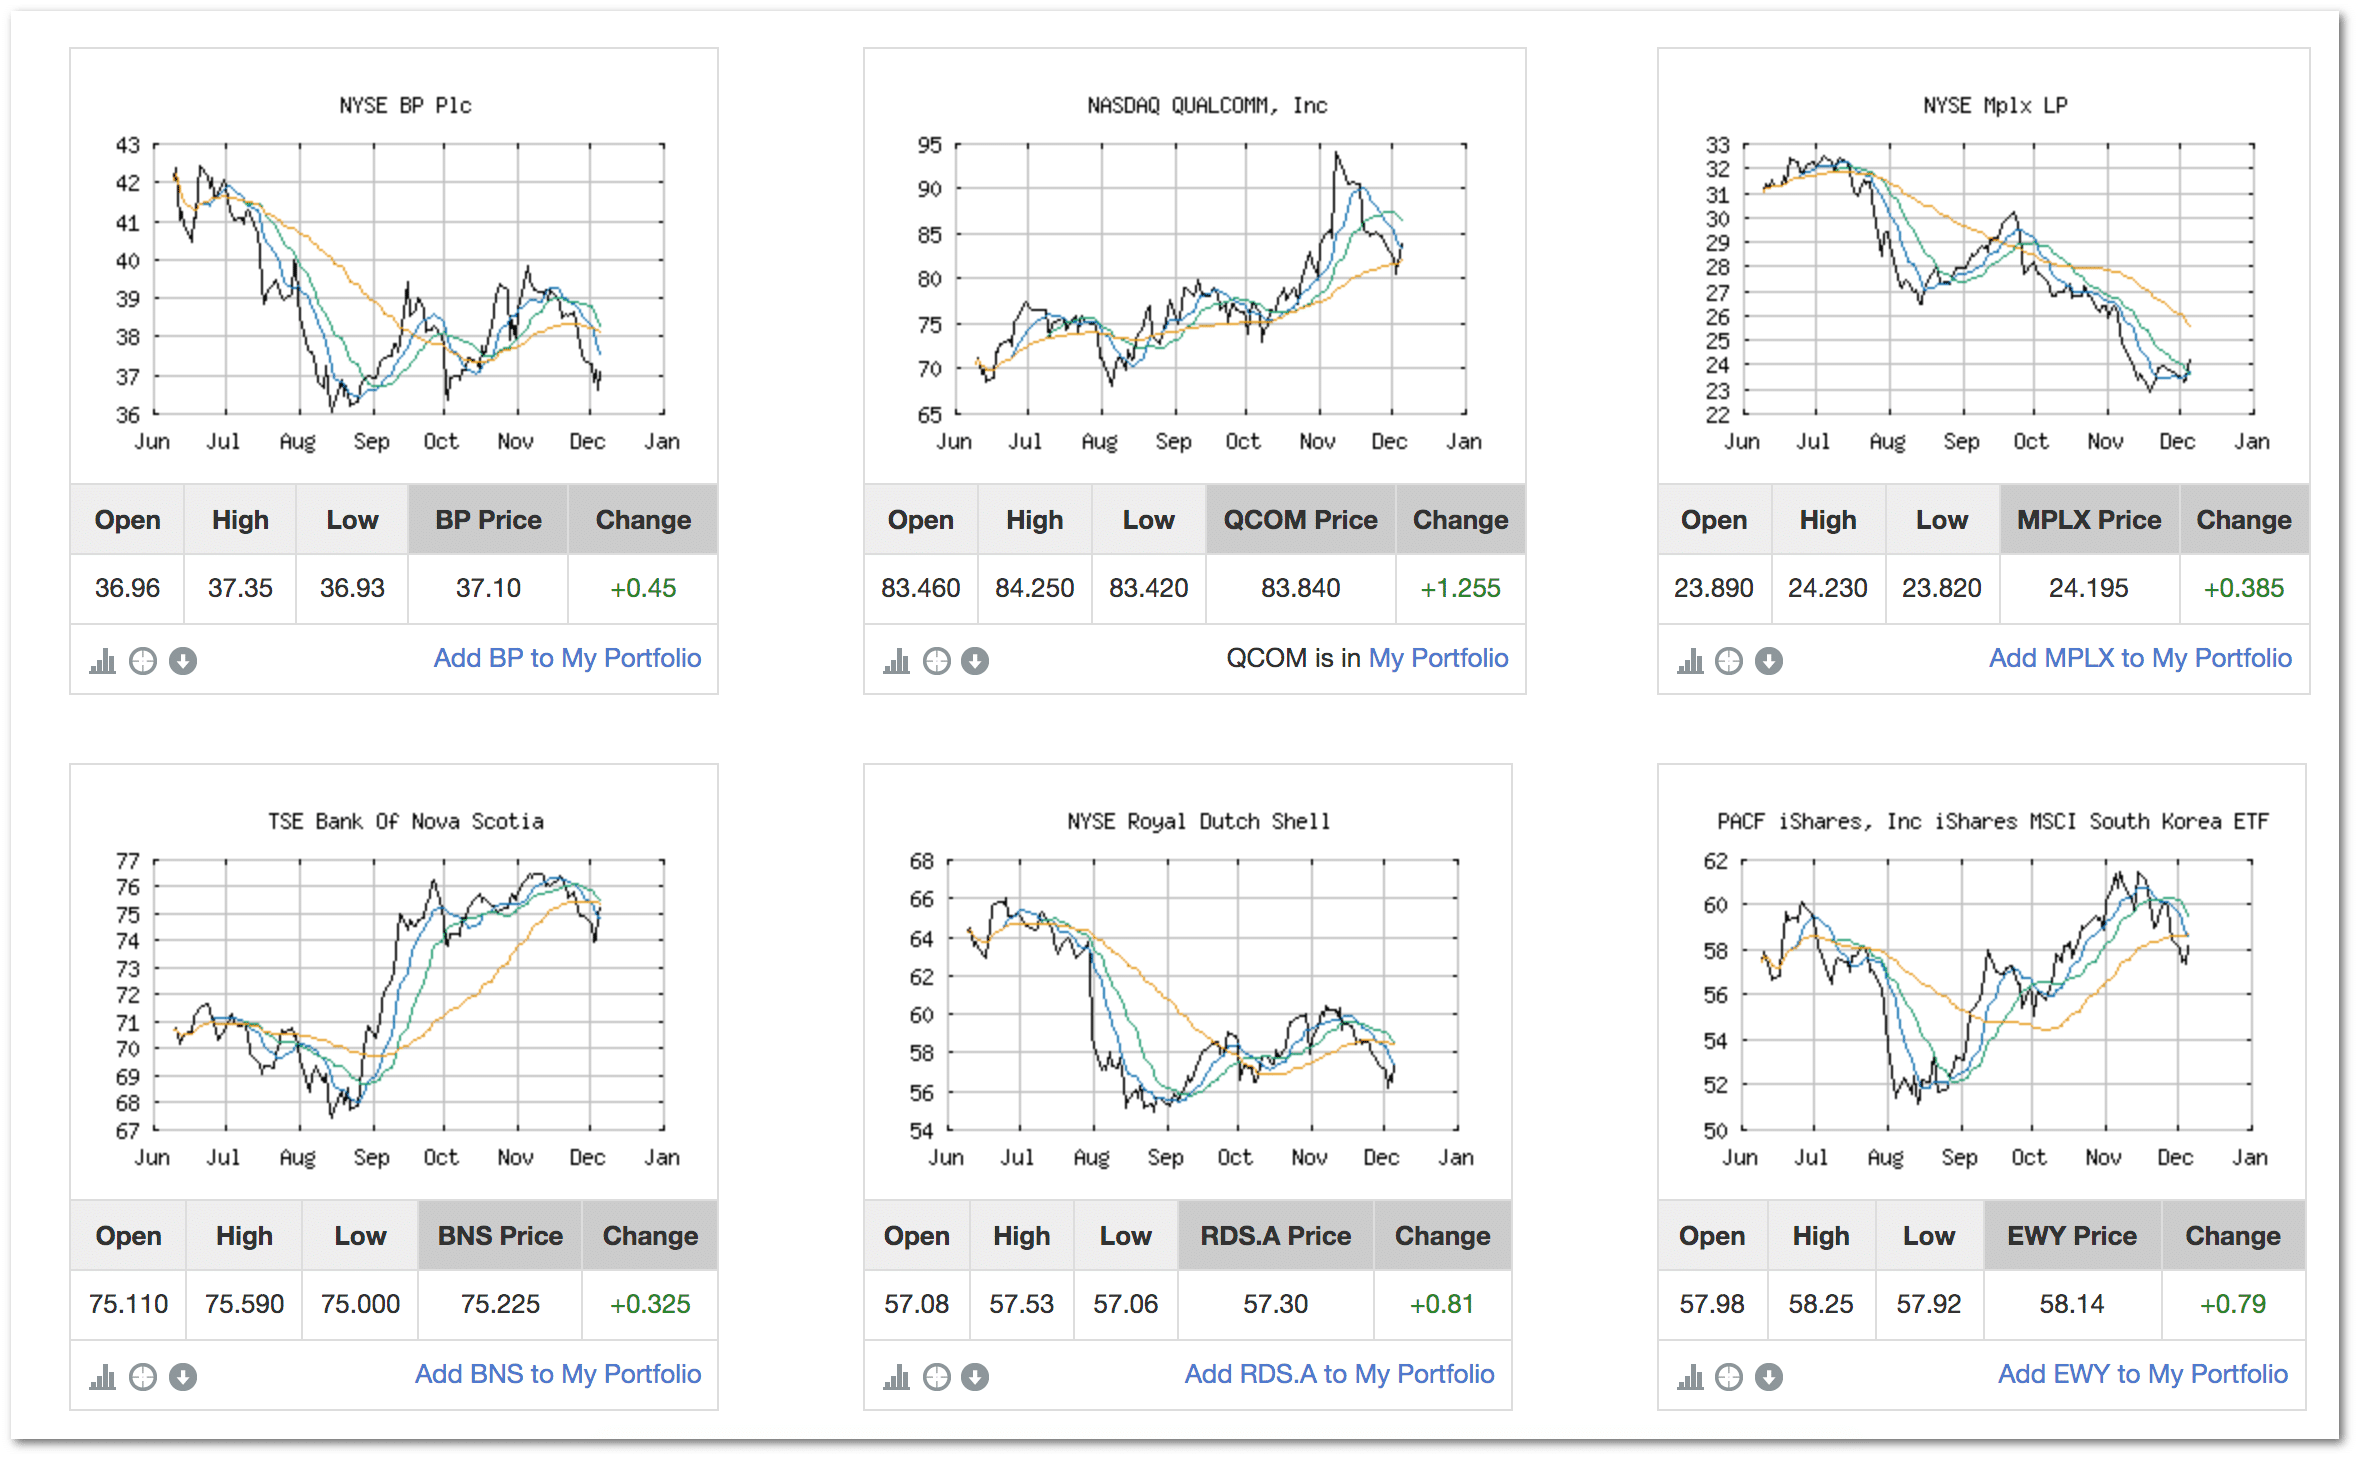
Once you peek at these charts, you can then add them to your watch list. Then, set an alert to receive a message when a new Trade Triangle is triggered and a stable trend is established.
Our powerful stock screener quickly reviews thousands of stocks every moment to find you the best trading opportunities.
From the strongest trends to new breakouts – we make technical analysis quick and easy!
Post updated July 13, 2021.