

If the world wasn’t strange enough right now, the oil market just took it up a notch.
On Monday, April 20, 2020, the May contract for WTI Crude Oil fell to negative $37/barrel, bizarre territory after a record-breaking price drop. Futures traders are rightfully concerned about decreased demand, overproduction, and limited storage space.
Non-essential travel is at a standstill, leaving cars and airplanes sitting with full fuel tanks. With the federal coronavirus taskforce’s multi-phase approach to re-open the economy, it looks like it may be weeks (possibly months) before consumers start refueling.
MarketClub detected a major bearish shift for the United States Oil Fund (USO) in early February. A monthly Trade Triangle triggered on February 3, 2020, at $10.70, for this exchange-traded fund (ETF) that tracks the spot price of light, sweet crude oil. Members received this signal 13 trading sessions before USO plummeted from a multi-week high of $11.42 made on February 20, 2020.
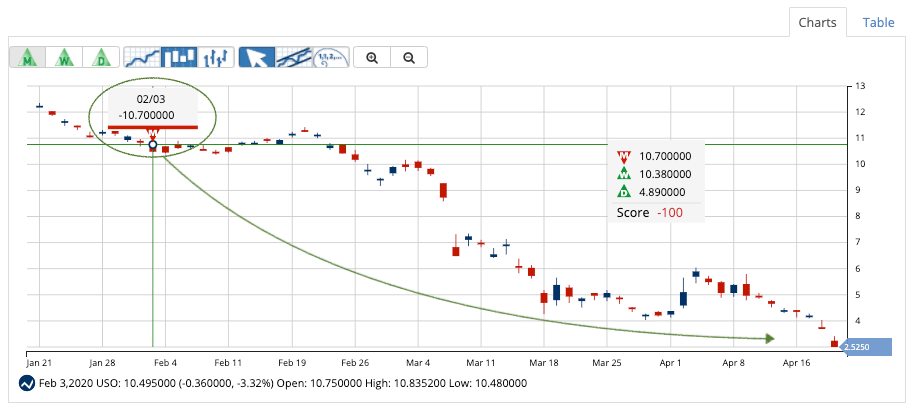
The red Trade Triangle, issued on February 3, 2020, signaled MarketClub members to exit a long position. This exit saved them from holding USO as the ETF dropped more than 75% (as of the open on February 21, 2020).
Members could have used the signal to enter a short position for USO, grabbing gains as the ETF fell to an all-time low.
What’s the Next Move for USO?
MarketClub members have the Chart Analysis Score at their fingertips. If and when the USO trend reverses, members will see the score increase and will receive Trade Triangle signals as the ETF establishes new short-term, intermediate, and long-term bullish trends.

Want the score and signals for USO or any other energy stock or ETF?
Join MarketClub now and get immediate access!