Following a tumultuous first half for 2020, investors are ready for a resurgence as we head towards the end of the year.
Earnings season showed some positive signs, and businesses that suffered from the COVID-19 shutdown have rebounded better than expected.
For one restaurant, the future looks bright with strong online sales and aggressive expansion, making it a smart play for both growth and value investors.
A Best-In-Breed Chain Restaurant With High Growth Potential
The Wendy’s Company (WEN) is a $5 billion chain restaurant brand with over 6,711 locations worldwide. It was ranked as the third-largest hamburger fast-food chain in the world as of 2018.
See our Top Options List – Did WEN make the cut?
The company reported a second-quarter earnings beat of $0.12 per share compared to the analysts’ estimates of $0.11 per share. Quarterly revenues fell short at $402.3 million versus $405 million. However, the company saw strong same-store sales in July driven by its digital menu offerings and its new breakfast line.
Wendy’s opened up 22 new restaurants outside of the United States, and its recent breakfast menu addition has proven more lucrative than management expected. As the global economy continues to recover from the coronavirus pandemic, Wendy’s is aggressively growing its brand.
The stock was last upgraded in May by Evercore ISI from an “in-line” recommendation to “outperform,” with a price target of $25 per share.
The Fundamental Core
The stock trades at 46 times earnings compared to the restaurants & bars industry average of 51 times.
Is WEN on today’s Top Options List? Click here to here to reveal the list.
The robust EPS growth rate estimate of 28% gives the stock an attractive PEG ratio of less than 2. This ratio is a signal to investors that the stock may be trading at a discount right now. The stock also comes with a small dividend yield of 0.90% giving investors some downside protection in turbulent markets.
The Technical Frame
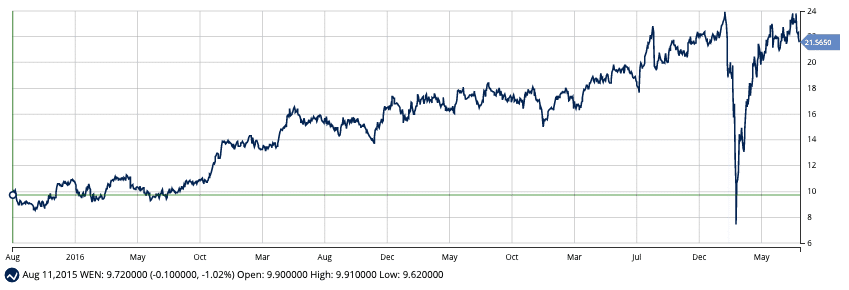
Looking at Wendy’s chart, we can see a sharp dip in mid-March, followed by a quick turnaround. The spike occurred during the initial outbreak of the coronavirus and has resumed a sideways trading trend.

There is some positive momentum building in the stock, with the 20-day SMA well above both the 50-day and 200-day SMA. The relatively high RSI of 67 suggests that the stock may be overbought right now – investors may want to wait for a pullback first before investing in Wendy’s.
The Bottom Line
Based on Wendy’s full-year EPS estimates, this stock should be fairly valued at around $25 per share. That value would be a gain of nearly 12% from its current trading price.
For investors seeking a post-pandemic comeback story, Wendy’s appears ready to deliver.
The above analysis of WEN was provided to MarketClub by Daniel Cross, professional trader and financial writer.
MarketClub’s Analysis of WEN
Based on MarketClub’s analysis, WEN is showing signs of a strengthening downtrend. While Wendy’s may have aggressive growth and positive sales activity, the technical trend is still pointing in a bearish direction.

MarketClub’s monthly Trade Triangle warned members in late February before WEN tumbled more than 60%. While the long-term trend is pointing positive once again, the intermediate and short-term trends are not in alignment.
Wendy’s is currently showing a -70 Chart Analysis Score. Members will keep WEN on their radar and follow the Trade Triangles according to their trading style.
Start your MarketClub trial to get a daily analysis, alerts, premium charts, and long-term outlook for WEN and over 350K markets.
