

The stock market is off to a strong start this week. Positive COVID-19 vaccine trials, a number of big acquisitions, and bullish strength for tech stocks are all making headlines.

On top of these news-driven moves, new intermediate-term technical trends have shifted for some heavy-volume stocks.
These stocks triggered a new green weekly Trade Triangle today, confirming that they are still in a strong bullish trend.
Learn more about the Trade Triangles and how they help MarketClub members ride the strongest stock swings.
New Signal for Vale (NYSE:VALE)
Vale, along with its subsidiaries, produces and sells iron ore (and pellets) as a raw material in steel making. The company is headquartered in Brazil but serves clients worldwide. Vale operates through three segments: ferrous minerals, base metals, and coal segments.
| Avg. Volume | 26,964,365 |
| Chart Analysis Score | +100 |
| Last Weekly Trade Triangle | 9/14/20 @ $11.73 |
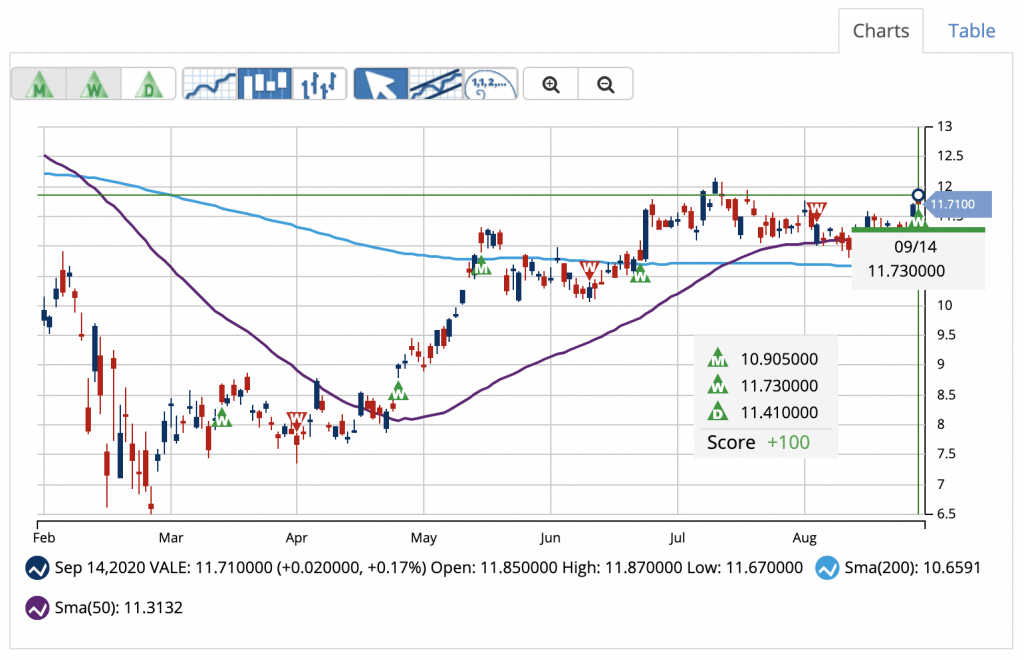
The bullish trend remains strong for VALE. Members received a long-term green Trade Triangle on June 5, 2020, at $10.90.
This weekly triangle confirms the presence of a bullish trend and the potential for the stock’s price to continue higher.
New Signal for Annaly Capital Management, Inc. (NYSE:NLY)
Annaly Capital Management, Inc. invests in and finances residential and commercial assets which include mortgage-backed securities and residential mortgage loans. This is a REIT that distributes its taxable income to its shareholders.
| Avg. Volume | 13,532,147 |
| Chart Analysis Score | +100 |
| Last Weekly Trade Triangle | 9/14/20 @ $7.54 |
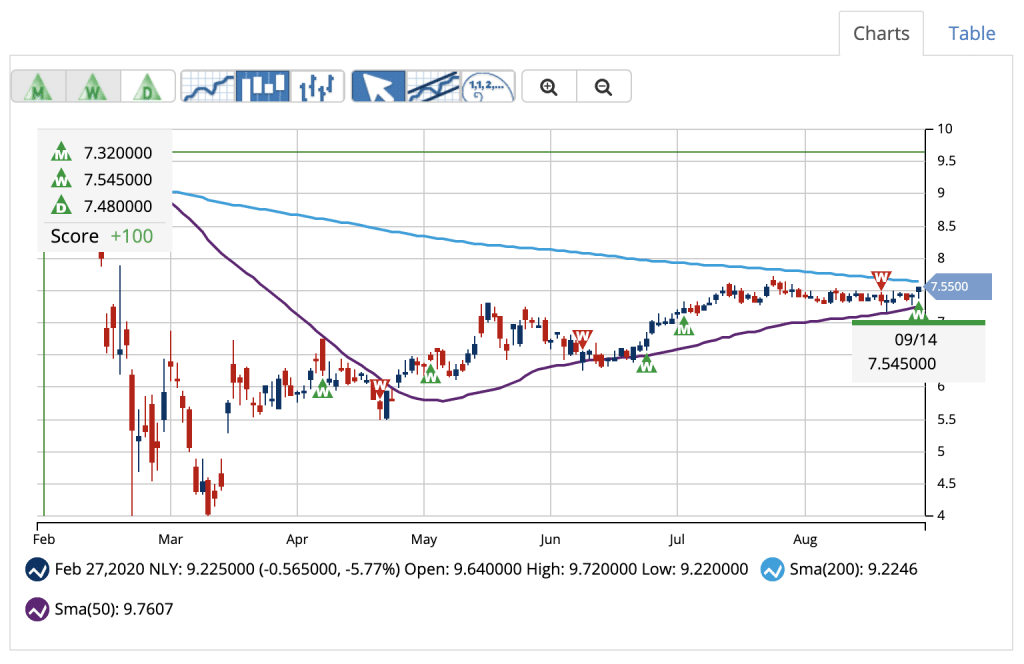
NLY’s stock price dropped more than 60% from late February to early April. However, the price has slowly moved into the $7.50 level as of mid-July.
MarketClub members received a monthly Trade Triangle on July 22, 2020, at $7.32. This new signal indicated that NLY’s trend had shifted towards the upside.
As of today’s weekly Trade Triangle, NLY has regained strong trend status with a +1oo Chart Analysis Score.
Micron Technology, Inc. (NASDAQ:MU)
Micron manufactures and sells memory and storage solutions to customers around the globe. Its product portfolio includes memory and storage technologies under the Micron, Crucial and Ballistix brands, as well as private labels.
| Avg. Volume | 19,079,128 |
| Chart Analysis Score | +70 |
| Last Weekly Trade Triangle | 9/14/20 @ $48.19 |
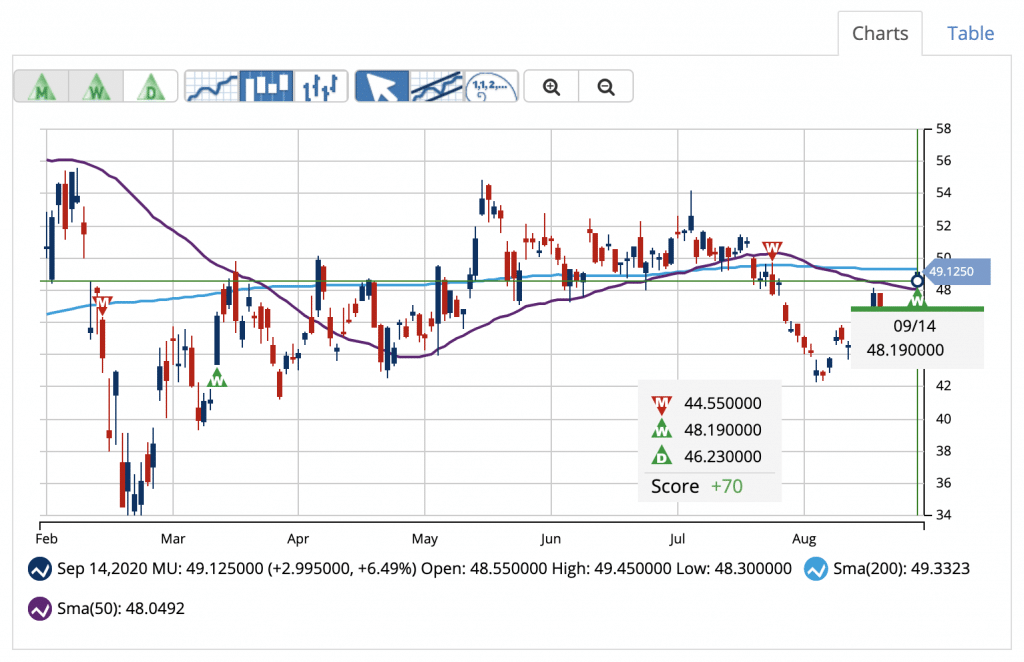
Micron is showing a Chart Analysis Score of +70. While MU has short and intermediate-term strength, the stock has yet to build enough technical momentum to trigger a monthly Trade Triangle.
Not yet in a firm uptrend, a move over $55.82 would swing this trend into firm bullish territory.
What other stocks, ETFs, futures, or forex pairs are flashing new Trade Triangles?
Members can log in and click the Trade Triangle tab to see the up-to-the-minute list.
Not a member? Not a problem!
Start your 30-day MarketClub trial and see the rest of the list right away.