

When it comes to stock analysis, Wall Street tends to breed purists. Those in the fundamental analysis camp pour through financial statements and carefully review critical ratios to determine a stock’s intrinsic value. Supporters of technical analysis watch investor activity and monitor trends to find key indicators and patterns that can predict price action.
While both types of analysis serve an important role, everyday investors are more likely to rely on technical analysis rather than fundamental analysis.
The knowledge base one needs to do fundamental analysis has to already be in place. You have to understand how to read financial statements and critically analyze future earnings based on various mathematical formulas.
On the other hand, services like MarketClub make technical analysis accessible through easy-to-use scans and visual tools.
An easy way to differentiate technical vs fundamental analysis is this quick rule of thumb – fundamental analysis tells you what to buy, while technical analysis tells you when to buy.
A Brief Overview of Fundamental Analysis
Evaluating a company’s qualitative and quantitative factors to determine intrinsic value is the core of fundamental analysis. The majority of fundamental data comes from a company’s public 10-k annual statement which is a required SEC filing for publicly traded companies.
Fundamental analysis may consider:
- Interest rates
- Gross domestic product (GDP)
- Industry trends
- Peer performance
- Profitable ratios
- Growth projections
In today’s market, most of the fundamental analysis legwork has already been done for you.
A quick stock search on any financial media site will give you key metrics such as the price-to-earnings (P/E) ratio, estimated future earnings growth profitability ratios, and more. However, understanding what this means for a company’s future is something that requires a decent background in finance.
A Brief Overview of Technical Analysis
Technical analysis relies on using data to project future price movements. After all, you are really just looking for recurring patterns in the way the stock price changes over time. Unlike fundamental analysis outputs, inferences made from technical analysis are more subjective.

While two analysts will likely agree on a fundamental piece of information, technical data leaves more room for interpretation. Analysis can be based on a large variety of factors such as investor buying/selling activity, momentum, volatility, and more.
Trend identification is a key concept in technical analysis. For example, monitoring trading volumes can tell you how other investors behave and what they think about a stock through buying and selling activity. Isolating patterns in a stock chart can help investors make predictions about where it might head next – up, down, or sideways.
Common Technical Tools for the Investor
One of the most popular tools for technical analysis is candlestick charts. These charts may look like hieroglyphics to the uninitiated, but understanding candlestick patterns can tell you a lot about a stock.
The candlesticks in MarketClub are either red or blue and can be displayed on an intraday, daily, weekly, monthly, quarterly or yearly time period. A red stick indicates that the stock’s closing price was below its open for a set period. A blue stick shows that the closing price was above its open price. The size of the stick body shows you the intensity of the trading activity.
The wick is the line above or below the stick body. This marking reflects the high and low of the trading period’s stock price.
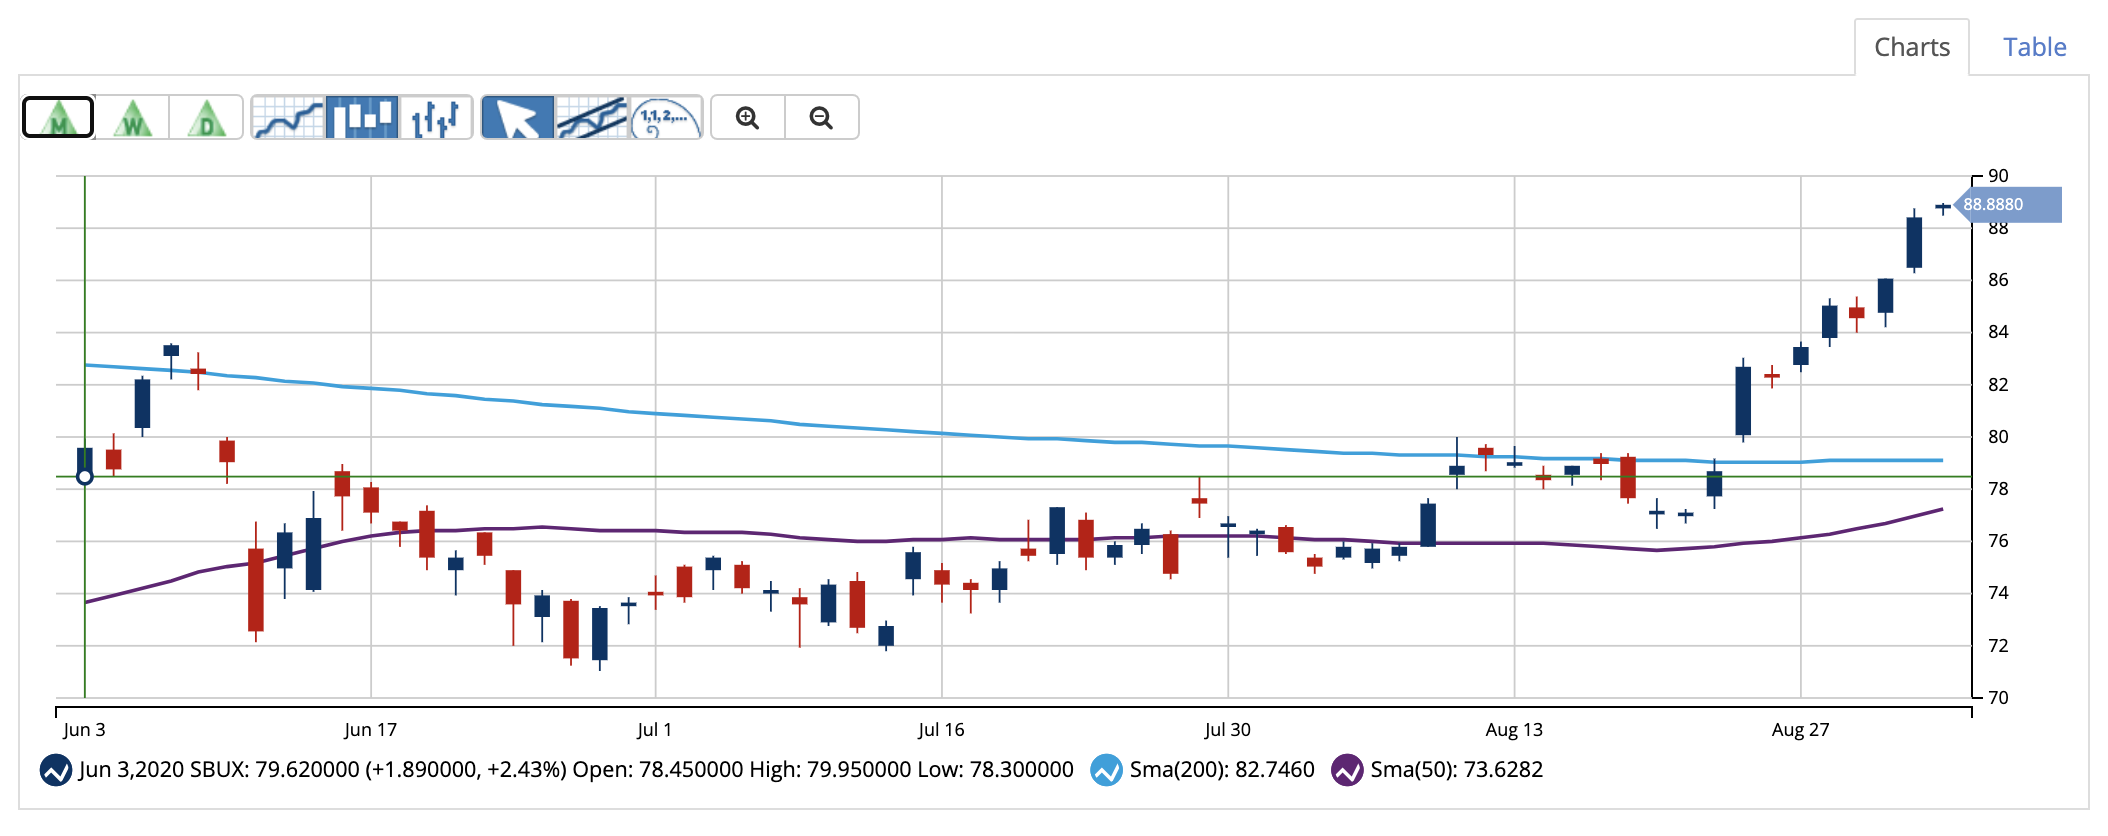
Another popular technical tool is the simple moving average (SMA). These trend lines tell you how the stock is moving based on recent past performance – typically 20-day, 50-day, and 200-day. A crossover point – when one SMA crosses over another – is generally a sign of a momentum change.
If the 20-day SMA crosses above the longer 50-day, it tells you that the stock is building positive bullish momentum. Crossing the 200-day is an even stronger bullish pattern known as a golden cross.
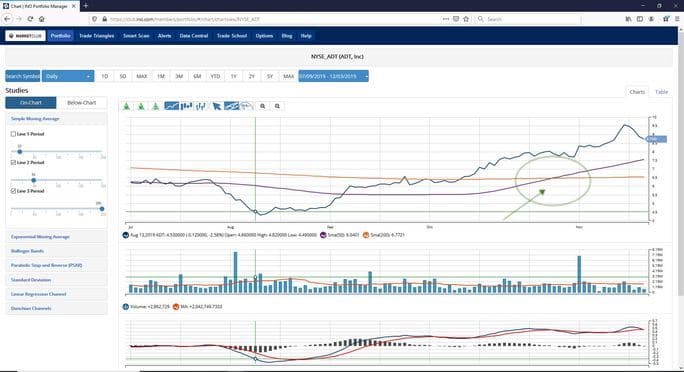
Other simple but powerful metrics include trading volumes and the relative strength index (RSI).
How a stock moves relative to trading volume can tell you whether the move is strong or weak. A drop in the stock price on lower-than-average trading volumes doesn’t mean much, but if it happens on higher-than-average volume, that could indicate a downward trend.
Along those lines, the RSI points to overbought or oversold conditions. Ranging from 0 to 100, an RSI over 70 generally indicates an overbought stock. A rating of less than 30 indicates that the stock may be oversold.
The Bottom Line
Understanding how and when to apply fundamental or technical analysis is a critical component of being a successful investor.
While fundamental analysis is generally provided for you, the ability to analyze a stock chart separates successful investors from unsuccessful ones – thankfully, MarketClub can help!
At MarketClub, we give you the tools to perform a wide range of technical analysis that will help you spot trends, avoid traps, and make predictions about where a stock is heading.
Start a 30-day trial to MarketClub and get instant access to:
- Trade Triangle Signals – entry and exit signals to ride the swings
- Technical Charts – beautiful charts with 20+ technical indicators and studies
- Top Lists – up-to-the-minute rankings of the strongest trends
- Scanning Tools – search through 350K charting setups for profit potential setups
- And More…
The above article was provided by Dan Cross, professional trader and financial writer. Get Dan’s weekly stock pick here.