
There’s no lack of fanciful names when it comes to technical investing.
From head-and-shoulders to cup-and-handle, investors are taught to look for certain shapes and patterns on a stock chart to gauge whether it should be bought or sold.
But, one of the most useful patterns for investors is also one of the simplest to spot – the golden cross.
What Is a Golden Cross?
A golden cross is a term used when the 50-day Simple Moving Average (SMA) crosses above the longer 200-day SMA. The 100-day SMA can be substituted in place of the 200-day SMA to broaden your search results as well.
A Simple Moving Average “smooths” out daily volatility in a stock letting you see how a stock is doing over a longer period of time. 50-day SMAs and under tend to be used for short-term movements while 100-day and greater SMAs reflect long-term movements.
When a short-term SMA crosses over a long-term one, it’s usually a signal that bullish momentum is picking up in the stock. Because long-term SMAs take a lot more time to influence, investors can use this to gauge a stock’s relative strength. The greater the time period used, the stronger and longer-lasting the breakout tends to be.
A death cross is usually associated with this pattern as well. It is the opposite of a golden cross, occurring when the 50-day SMA crosses below the 200-day SMA and signals a strong bearish trend in the stock, warning investors to get out before they suffer too many losses.
How To Find A Golden Cross
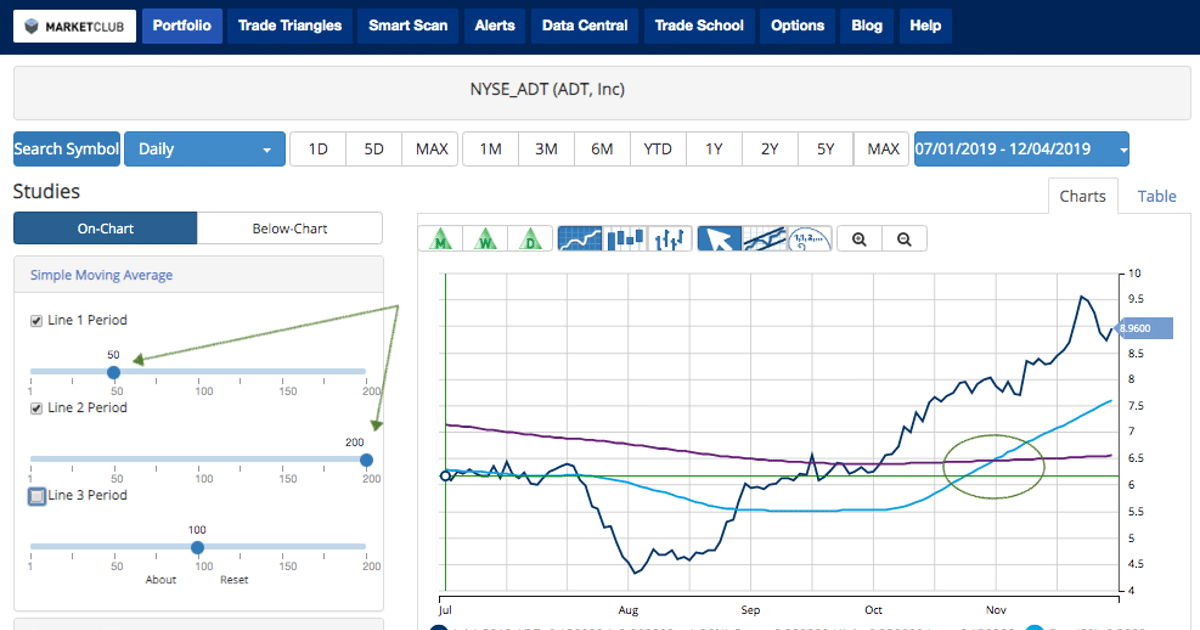
You can spot golden crosses easily using MarketClub’s tools.
Let’s try it out using ADT as an example:
First, we will need to set our Simple Moving Averages to 50 and 200 to show us the 50-day and 200-day SMAs. Now it’s just a matter of finding where the 50-day line hops over the 200-day line, which in this case happened between November 5th and 6th.
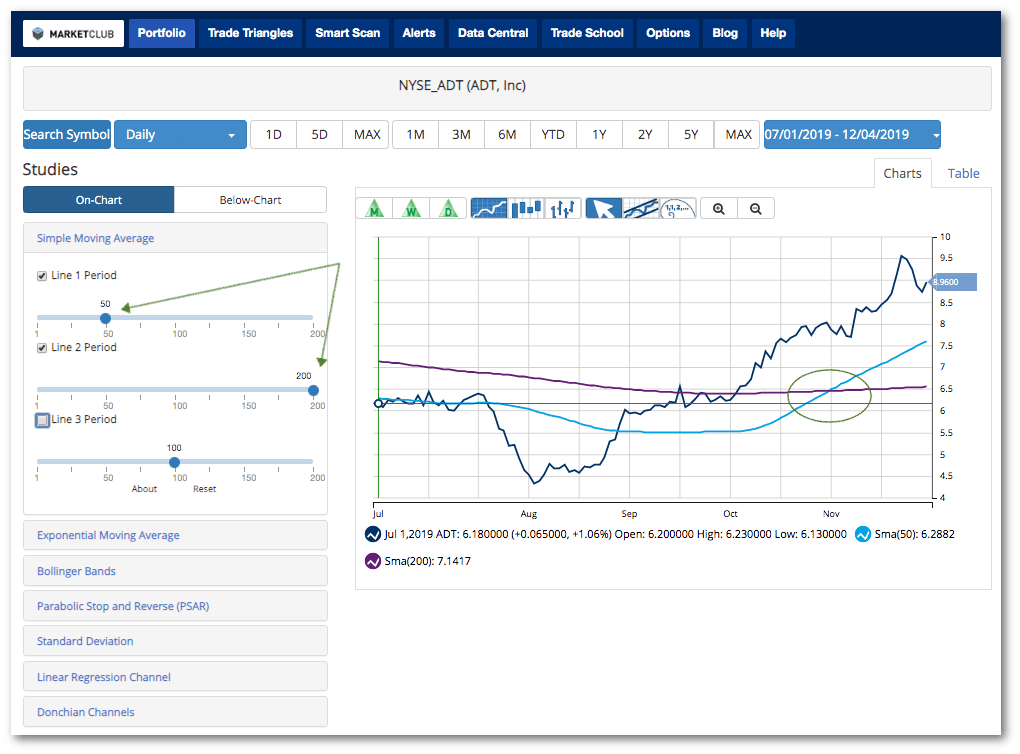
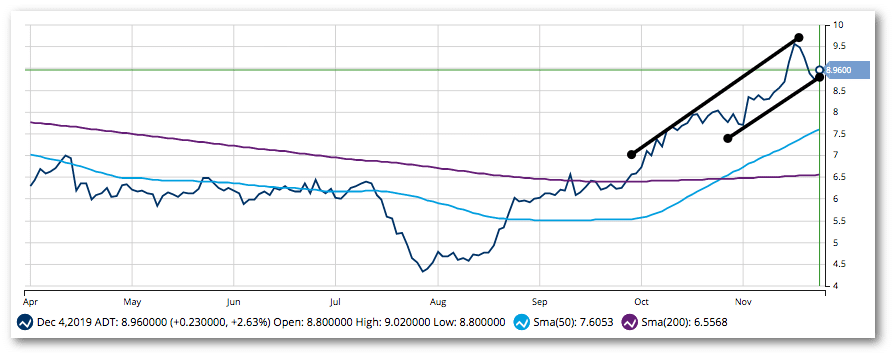
Now that you have a reference point, you can see where the stock began to trend higher right before the cross-over and continuing onward as it picked up bullish momentum.
That’s all there is to finding and reading a golden cross – it’s that fast and easy!
Final Thoughts
The golden cross is a widely used technical indicator on Wall Street that’s commonly applied to stock indexes like the S&P 500.
When analysts talk about bullish or bearish indicators in the markets, the golden cross and its much-feared antithesis, death cross, are often what they are making reference to.
By taking advantage of investor tools at MarketClub, you can analyze the markets yourself to quickly find golden crosses and keep your portfolio running smoothly.