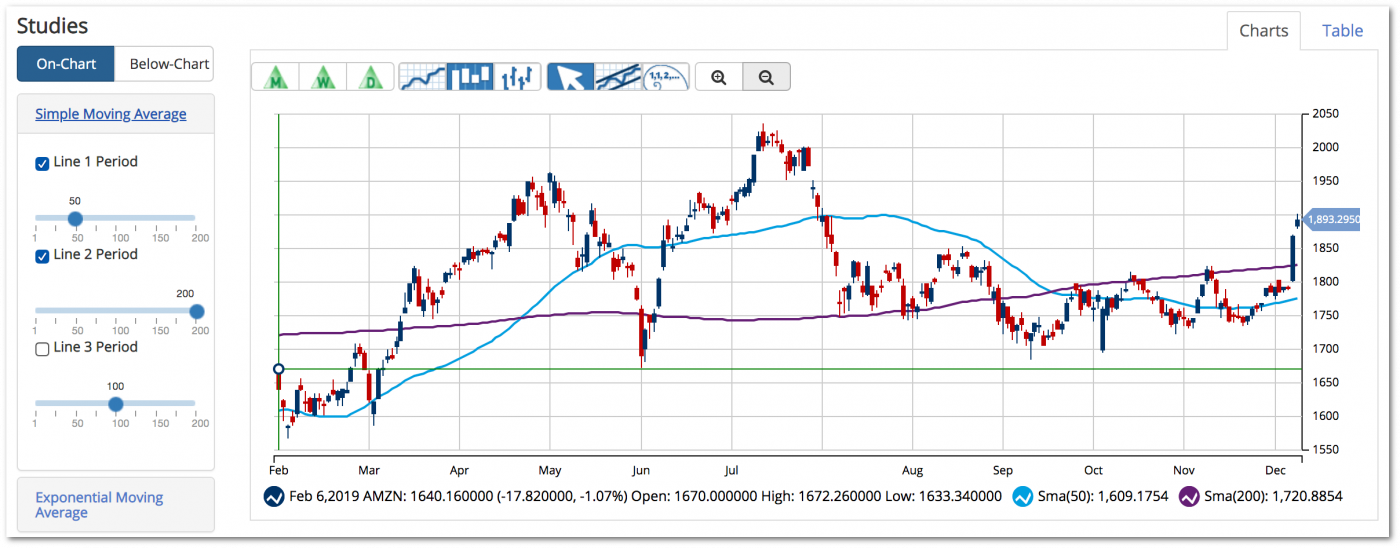
Technical analysis uses stock charts, trading volumes, and other day-to-day market data to find trends and gauge overall investor sentiment about a stock.
Applying this analysis to your research methodology can help you pinpoint the best buying opportunities and avoid costly mistakes.
It’s important to note that technical indicators aren’t perfect analytical tools. You should always take care to use more than one indicator before determining if a stock is headed up or down.
What Is A Technical Trader?
A technical trader analyzes price action and chart patterns to predict the future movement of a security’s price. From analyzing trends to spotting predictive chart setups, technical traders tend to ignore basic fundamentals like intrinsic value.
How Do You Become a Technical Trader?
Before you start analyzing stock charts and making timely profitable trades, you’ll want to become familiar with some of the basic terms and definitions.
It might seem like technical analysis is a complicated process that requires advanced mathematical knowledge and precise data collection. With practice, some basic information and the right tools, you can start your journey towards becoming a technician.
Technical Analysis Tools
Candlestick Charts
Candlestick charts show price action as a red or blue rectangle (sometimes white and black) with a vertical line at the top and the bottom of it.
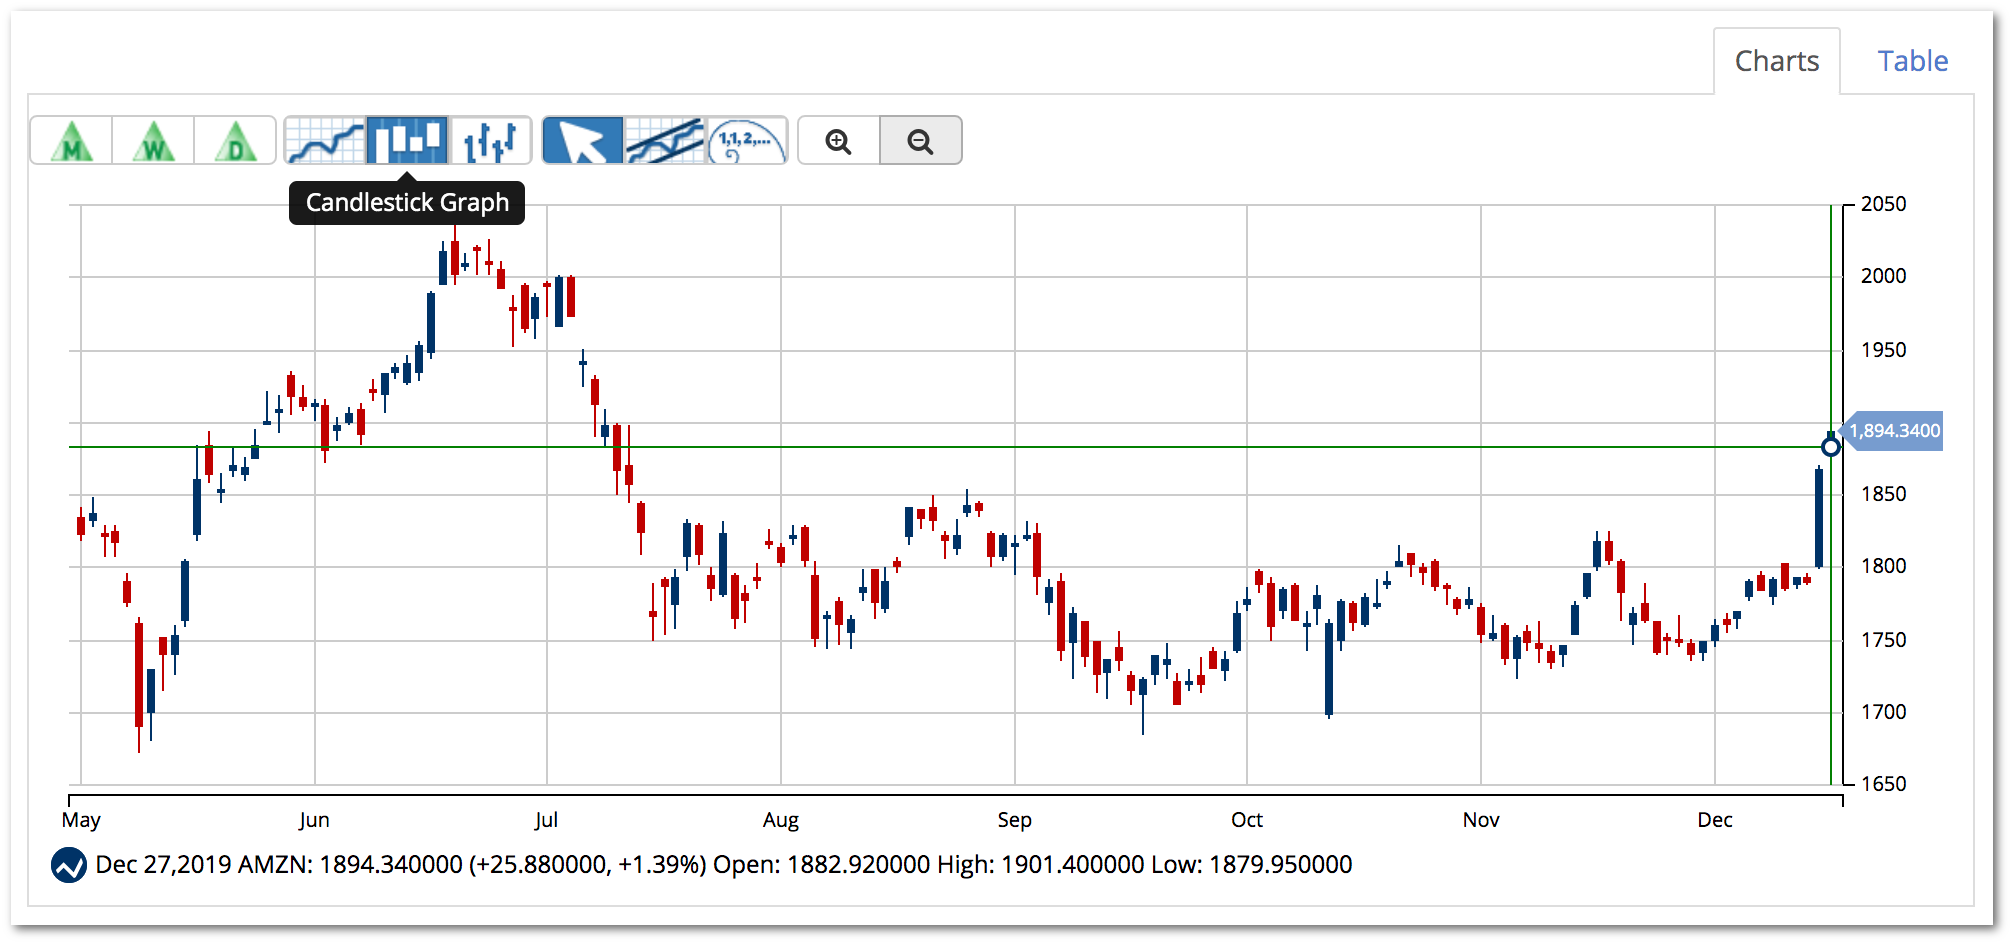
A blue candlestick means that the closing price of a stock was higher than the opening price, while a red candlestick means that the closing price was lower than the opening one. The small vertical lines on the top and bottom tell you the intraday high and low for the stock.
Moving Averages
A Simple Moving Average (SMA) is calculated by adding up a series of closing prices and then dividing by the number of days used.
For example, a 20-day SMA adds up the past 20 days of closing prices and divides that figure by 20.
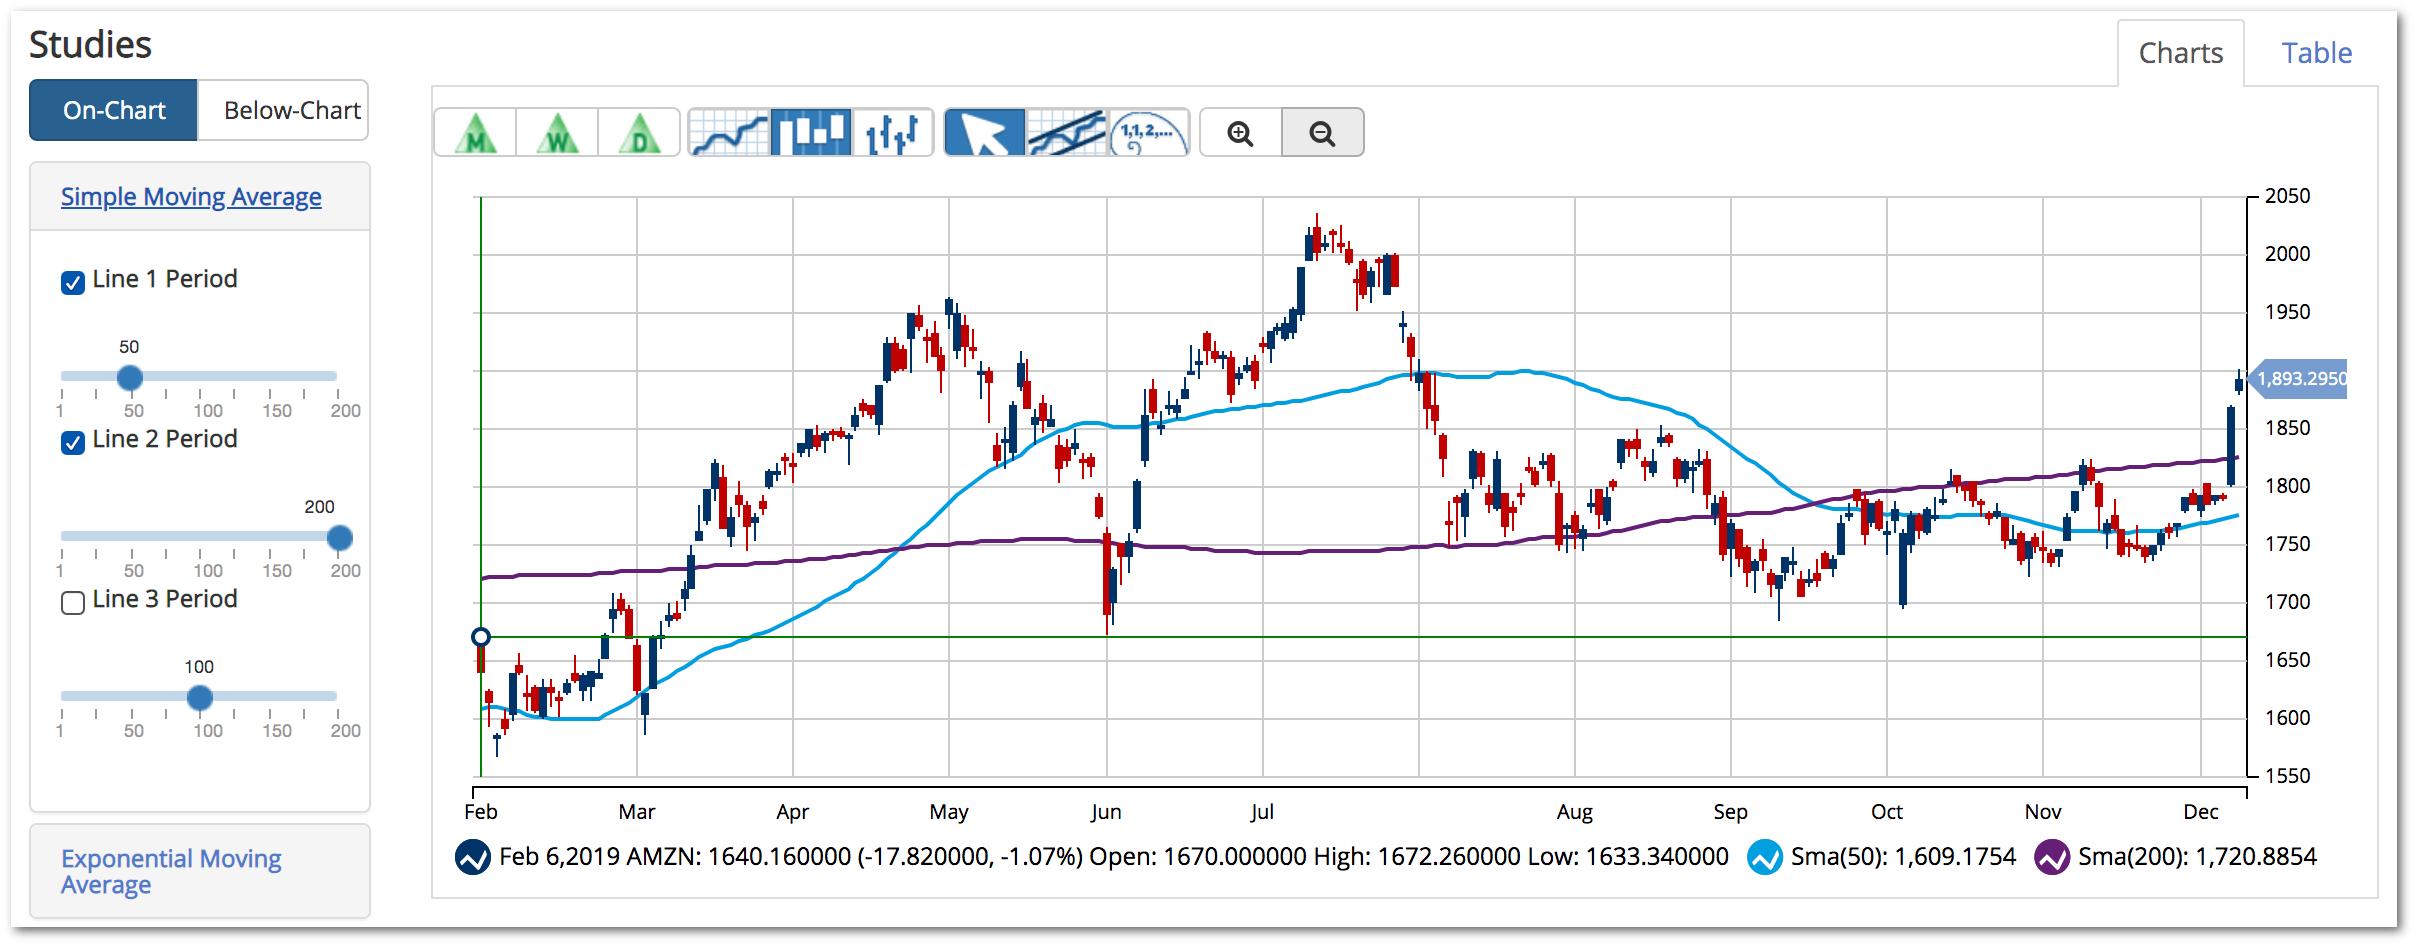
This indicator helps investors analyze a stock’s long-term trend by smoothing out volatility spikes. It also allows you to compare various length SMAs to find critical cross-over points that indicate bullish or bearish momentum trends.
While this tool’s name may deceive, the SMA can be used in a number of ways to offer great insight.
Relative Strength Index (RSI)
The Relative Strength Index (RSI) is displayed as an oscillator that can range from 0 to 100 and tells investors whether a stock is overbought or oversold.

Values of 70 or more usually mean that a stock is overbought. A reading of 30 or less means that it is oversold. Investors should note that overly strong bullish or bearish momentum can trigger an overbought or oversold signal. This does not necessarily mean that the stock is actually going to reverse course.
Williams % R
Williams %R is a powerful technical analysis tool used to spot overbought and oversold conditions.
This momentum indicator, developed by Larry Williams, compares the current closing price to the high and low of a certain period, normally 14 days.
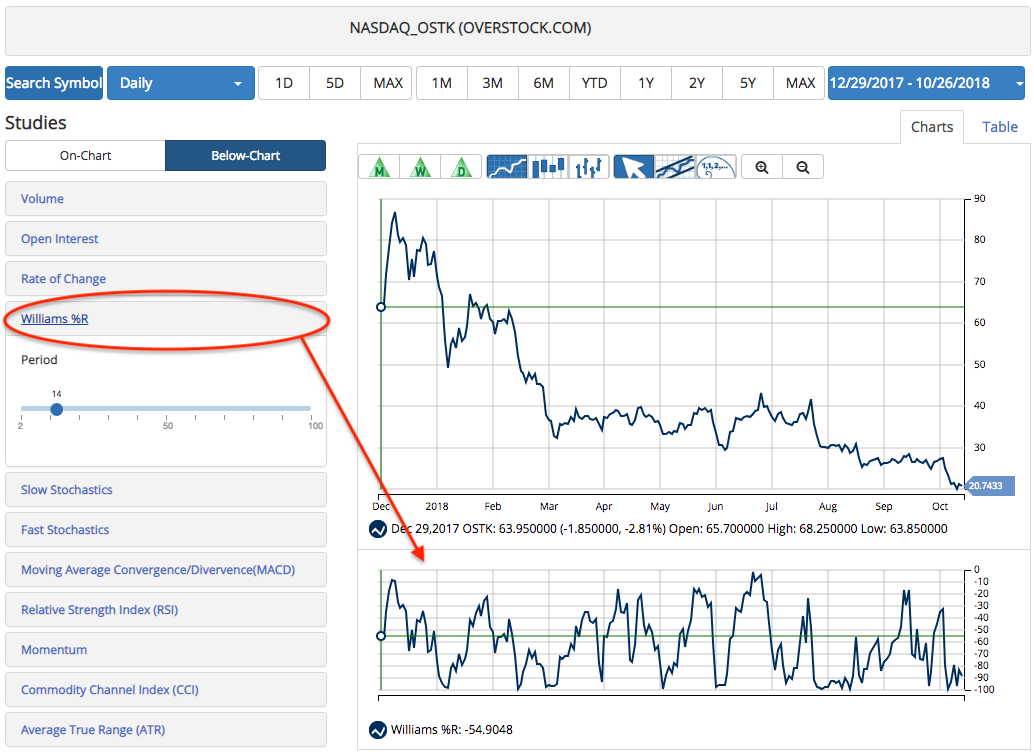
The Williams %R helps identify overbought and oversold conditions and can be used to find entry and exit points.
While similar to the Stochastic Oscillator, Williams %R uses a negative scale and oscillates between 0 and -100. The indicator will typically have levels marked at -20 and -80, as well as a midpoint at -50.
If the current closing price is near the top of the high-low range, the indicator will read closer to 0. However, if the current closing price is near the bottom of the high-low range, the indicator will read closer to -100. A closing equal to the high of the high-low range will read 0.
If using the default period of 14, readings from 0 to -20 are considered overbought. Readings from -80 to -100 are considered to be oversold.
It is important to remember that markets in strong uptrends can become overbought and remain overbought, indicating sustained buying pressure. Conversely, markets in strong downtrends can become oversold and remain oversold, indicating sustained selling pressure. Learn more about Williams %R.
Bollinger Bands
Developed in the 1980s by John Bollinger, Bollinger Bands is a technical analysis tool that illustrates volatility and determines overbought or oversold market conditions.
Comprised of a simple moving average (SMA) and two lines of standard deviations, the lines of the study sandwich the chart’s price action.
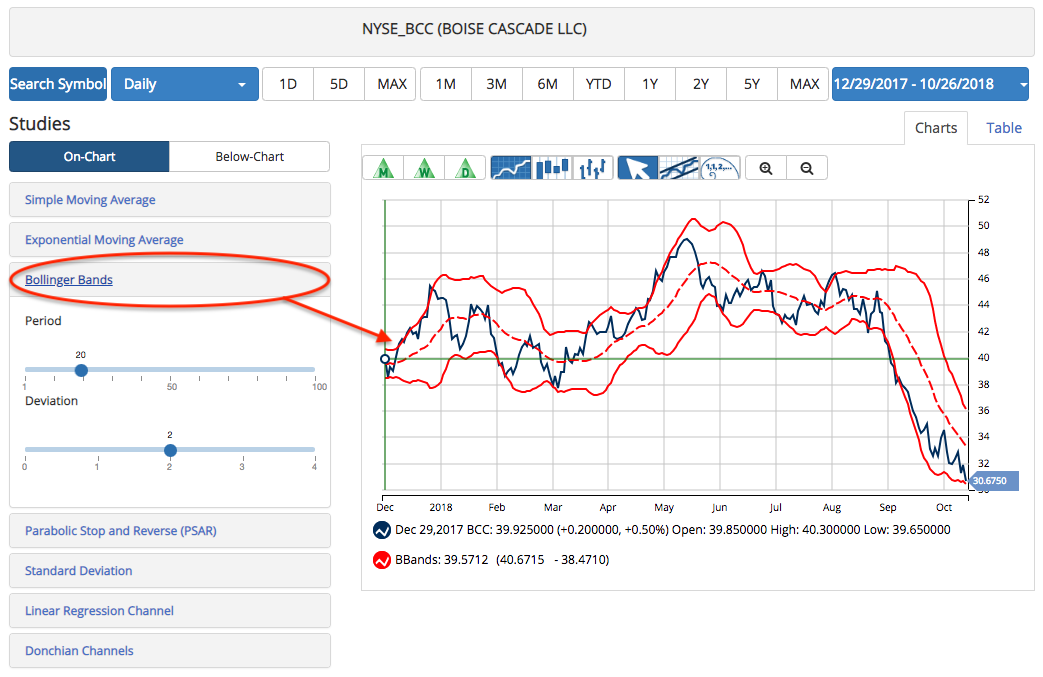
One of the most popular technical indicators, Bollinger Bands are easy to read and alert of significant price action moves.
The Bollinger Bands are made up of a set of three bands plotted in relation to the security’s price action.
The middle band is typically a simple moving average set at 20 periods.
Traders typically set the upper and lower bands at two standard deviations above and below the middle band.
Trading Volume
It might seem strange to list volume as a technical tool, but matching trading volumes to price jumps or price drops can reveal the relative strength of the movement.
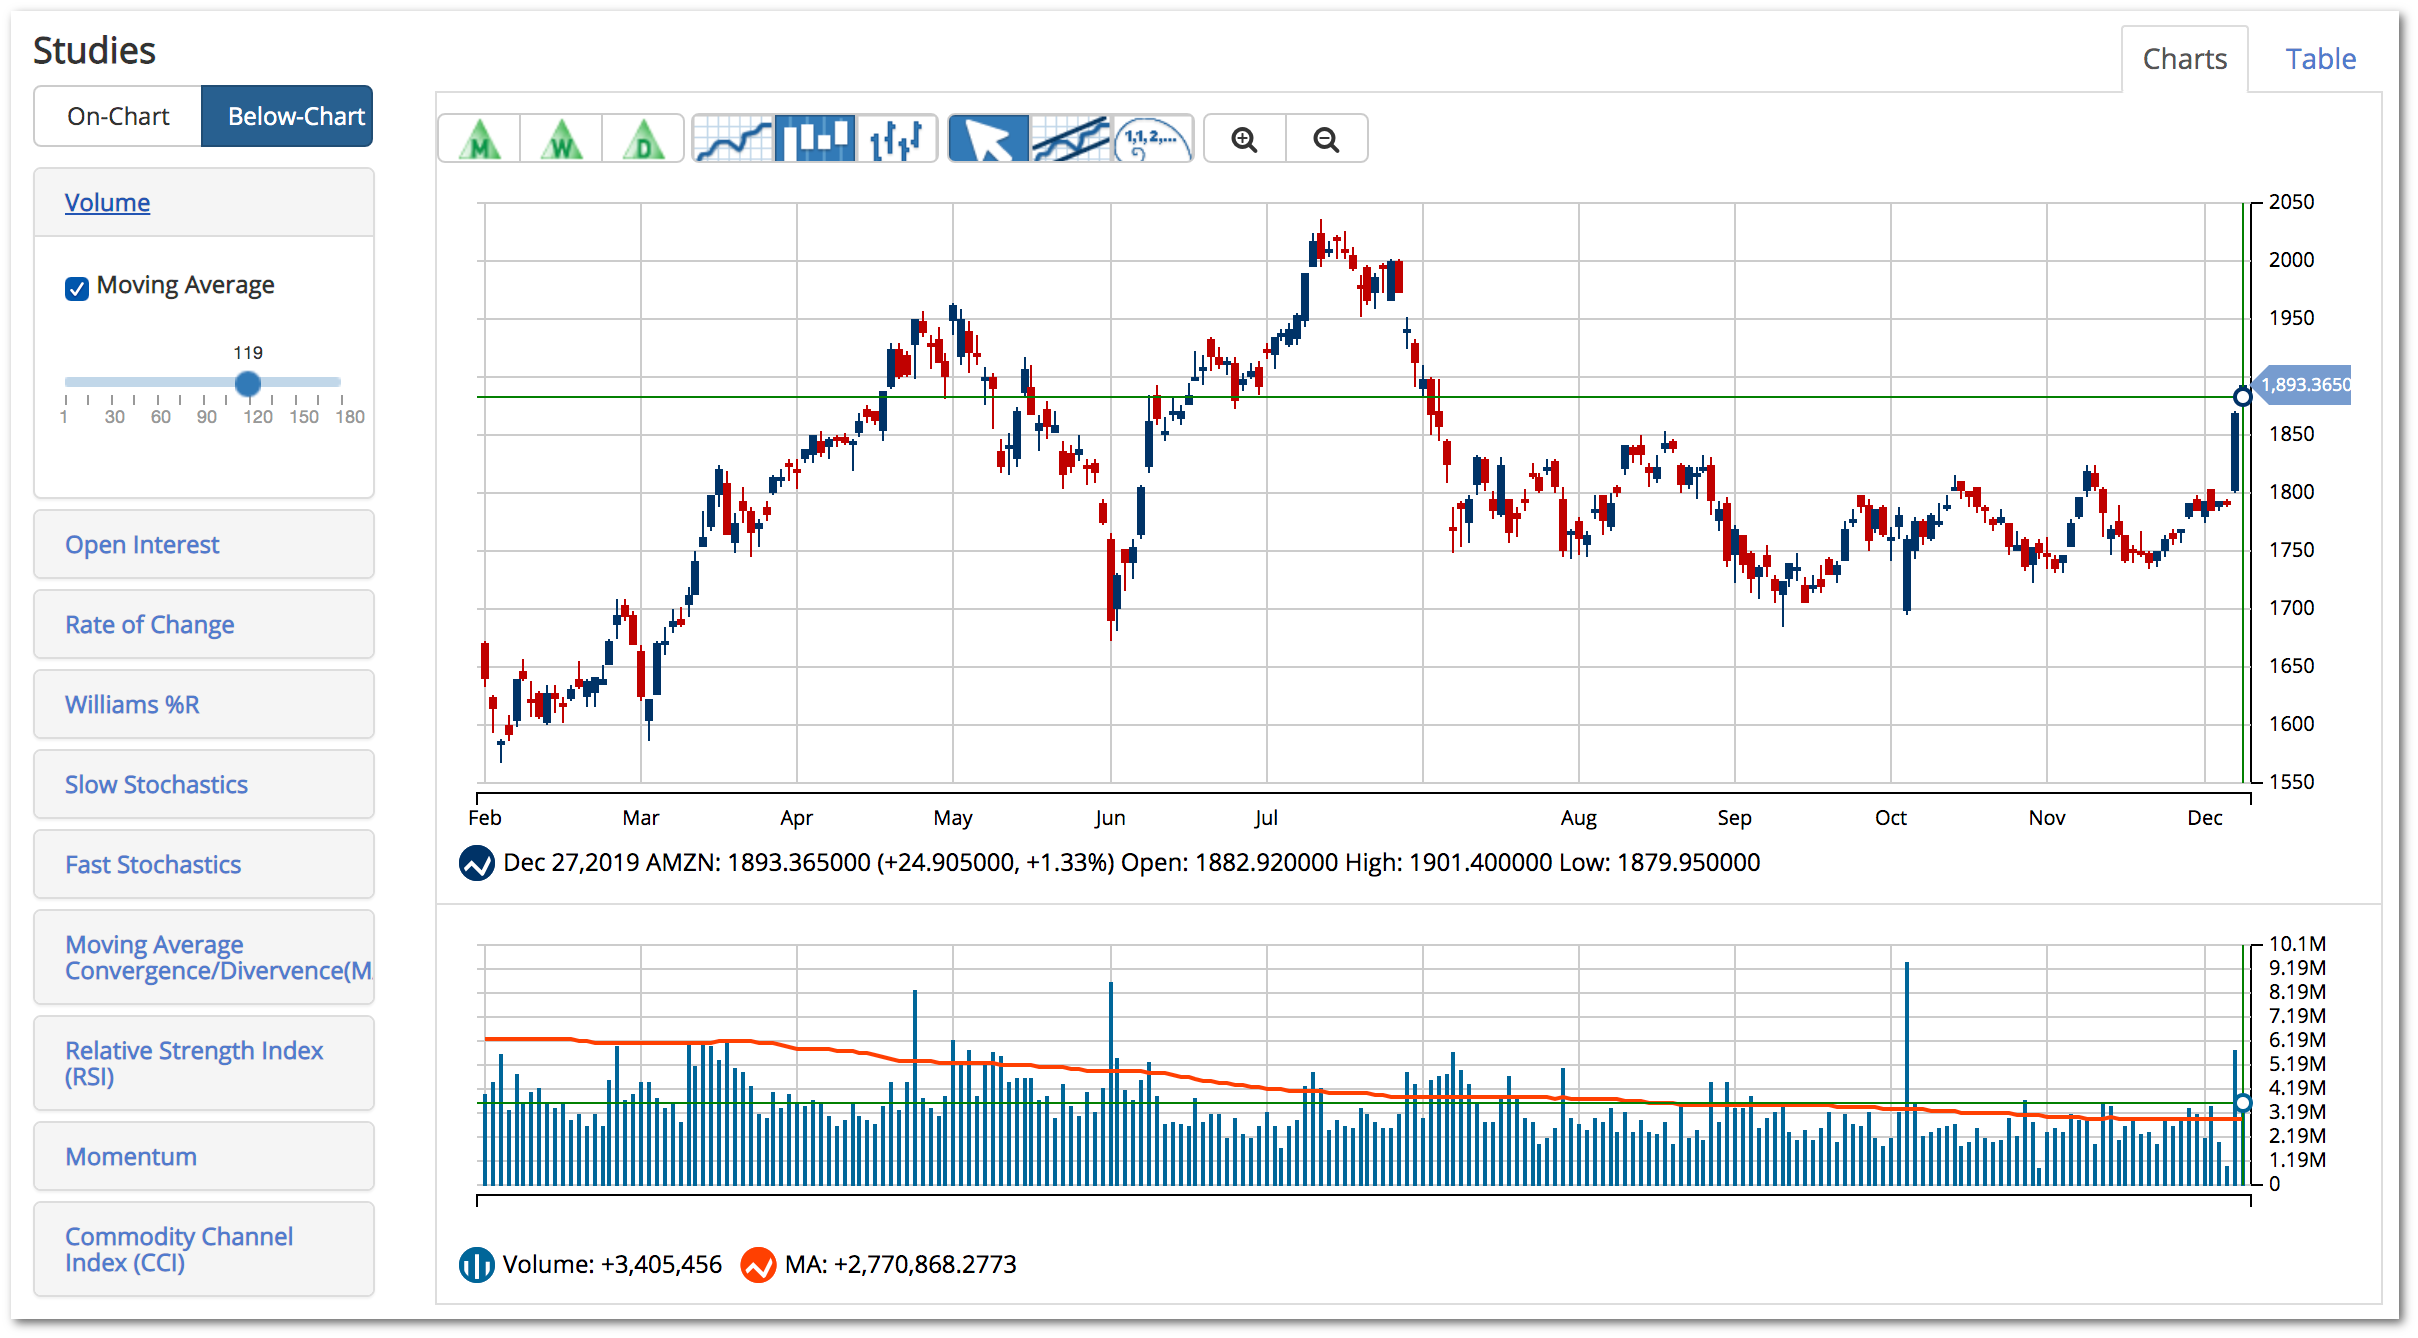
If a stock makes a significant move up or down but occurs on lower-than-average volumes, it means that there isn’t a lot of pressure to sustain that movement. On the other hand, if it happens on larger-than-average volumes, that could indicate a strong shift in momentum.
Trade Triangles
The Trade Triangles are MarketClub’s proprietary signaling system. We run every price tick through our algorithm looking for changes in trend and momentum.
When our system recognizes a major shift in the short-term, intermediate-term, or long-term trend, a new Trade Triangle is issued.
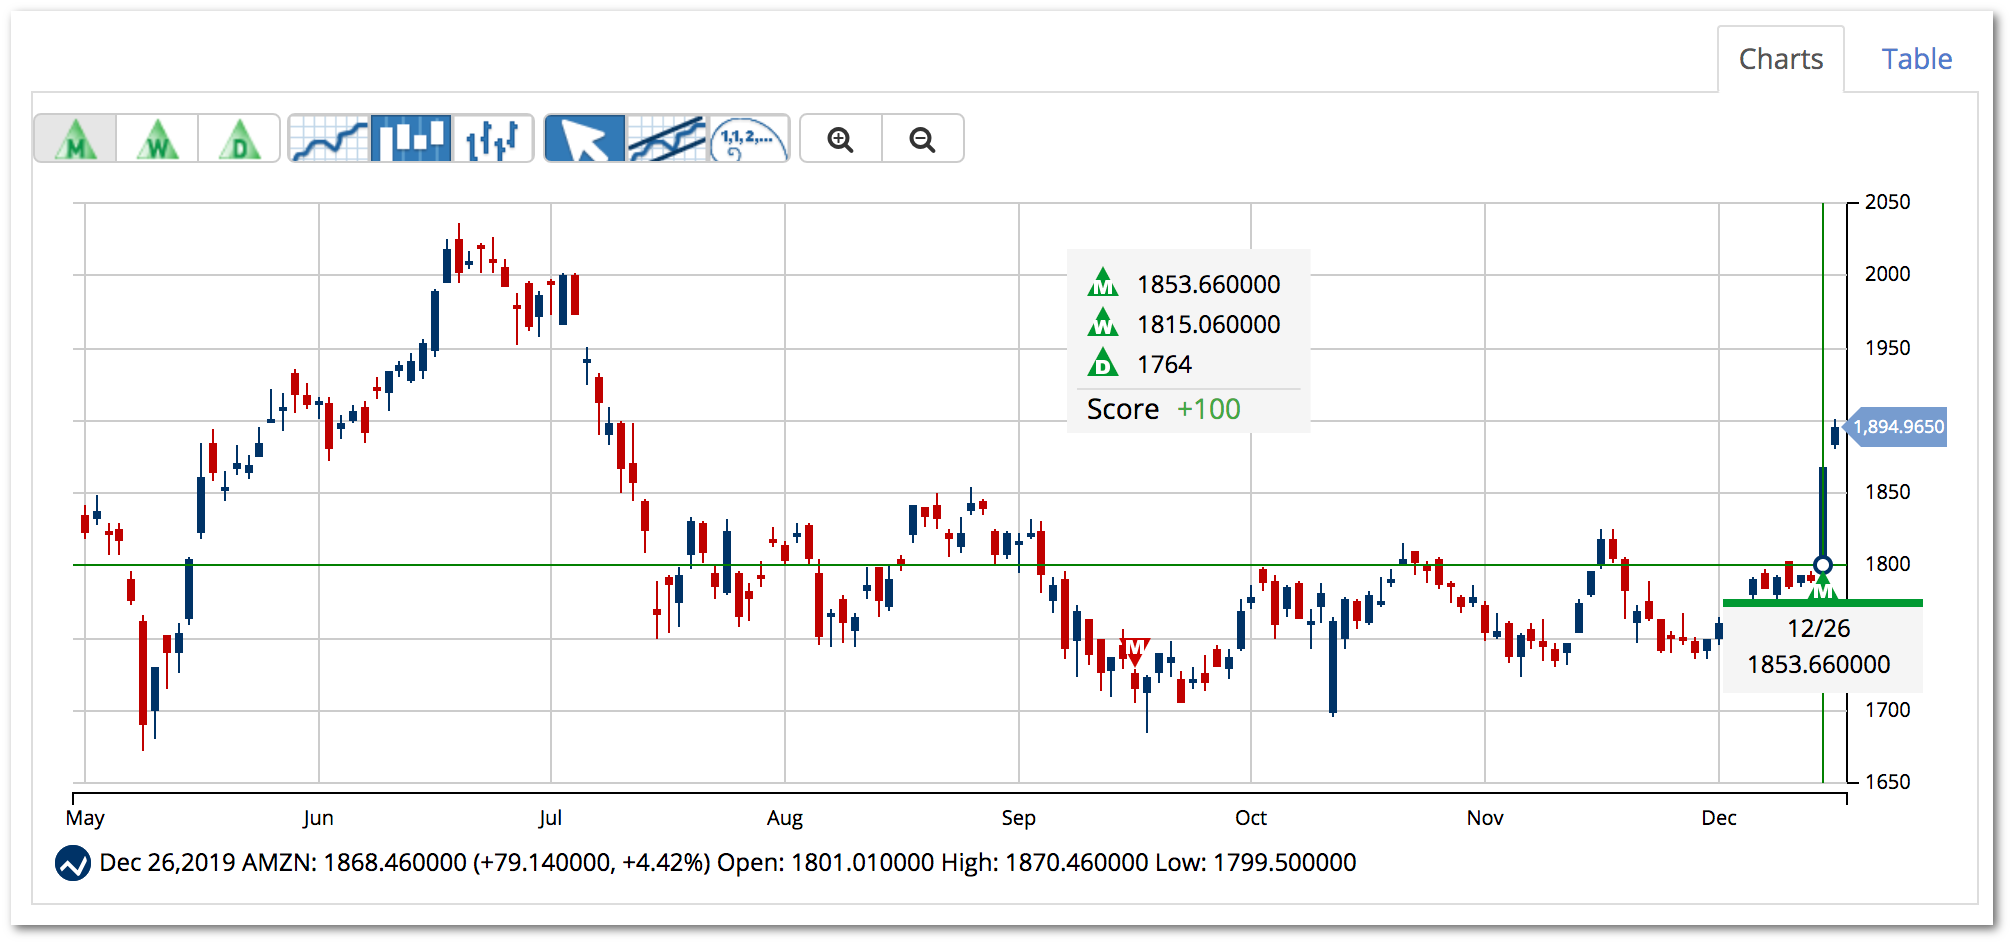
Members can use these signals to enter and exit positions based on their trading style. Learn more about the Trade Triangles.
Putting It All Together
Equip yourself with technical analysis basics to spot buying and selling points, identify trends, and gauge how strongly the momentum is impacting a financial instrument.
Using the technical tools at MarketClub, you’ll be able to better pick apart trades and make more confident investment decisions.
