
New York Stock Exchange (NYSE) Core Hours: 9:30 AM – 4:00 PM E.TCalendar Details NASDAQ Core Hours: 9:30 AM – 4:00 PM E.TCalendar Details Toronto Stock Exchange and TSX Venture Exchange (TMX) Core Hours: 9:30 AM – 4:00 PM E.TCalendar Details Canadian Securities Exchange (CSE) Core Hours: 9:30 AM – 4:00 PM E.TCalendar Details

New York Stock Exchange (NYSE) Core Hours: 9:30 AM – 4:00 PM E.TCalendar Details NASDAQ Core Hours: 9:30 AM – 4:00 PM E.TCalendar Details Toronto Stock Exchange and TSX Venture Exchange (TMX) Core Hours: 9:30 AM – 4:00 PM E.TCalendar Details Canadian Securities Exchange (CSE) Core Hours: 9:30 AM – 4:00 PM E.TCalendar Details

The technology industry is a fast-paced innovative business environment where growth of less than 10% per year is considered too slow. In all technology segments, new developments such as IoT and cloud computing mean that companies need to stay ahead of the competition if they want to survive. Aside from outperforming their peers, companies need…

If you look at any of these precious metal ETF charts, you’ll notice that a strong bullish trend has been rockin’ since the new year. With some short-term weakness, it may look like these trends have cooled – but, look again. New MarketClub signals have confirmed that the upward trend remains strong for these precious…
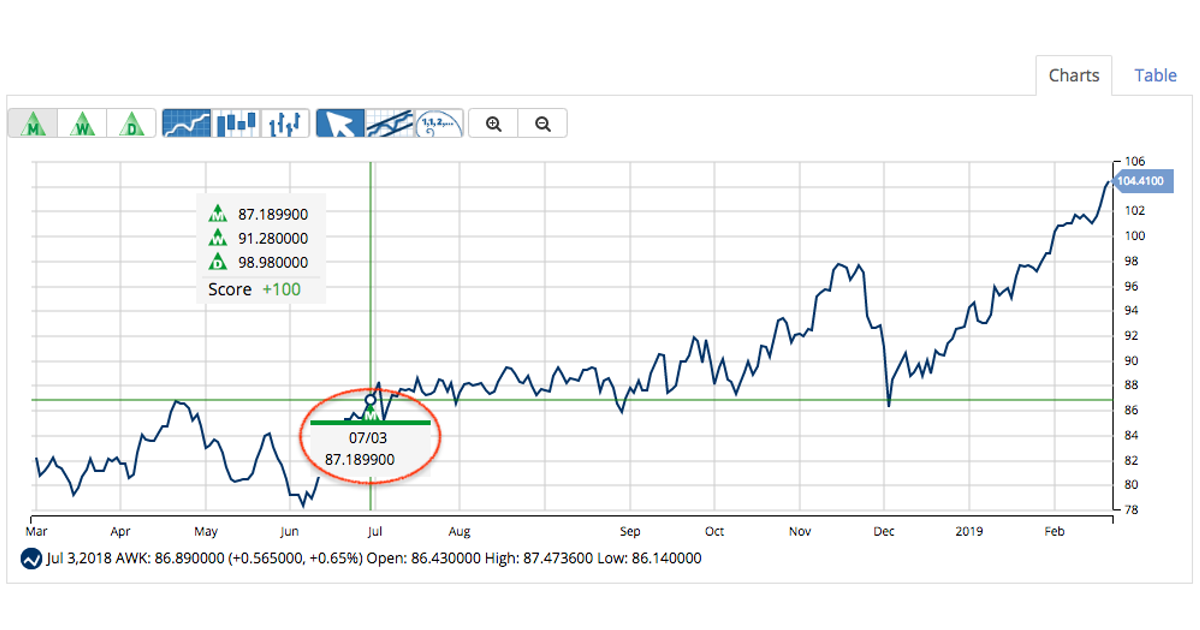
One of the most attractive features of a utility stock is its defensive capabilities. Consistent earnings regardless of economic conditions and low beta ratios make for an ideal safe-haven asset. When you can find a stock that meets that criteria, but comes with the additional bonus of positive momentum, it’s worth taking a closer look.…

Moving Average Convergence / Divergence (MACD) is one of the most popular studies for technical traders. This trend-following, momentum indicator, developed in the late 70s by Gerald Appeal, shows the relationship between two moving averages. Traders can use signal line crossovers, centerline crossovers, and positive and negative divergences to generate signals and spot changes in…
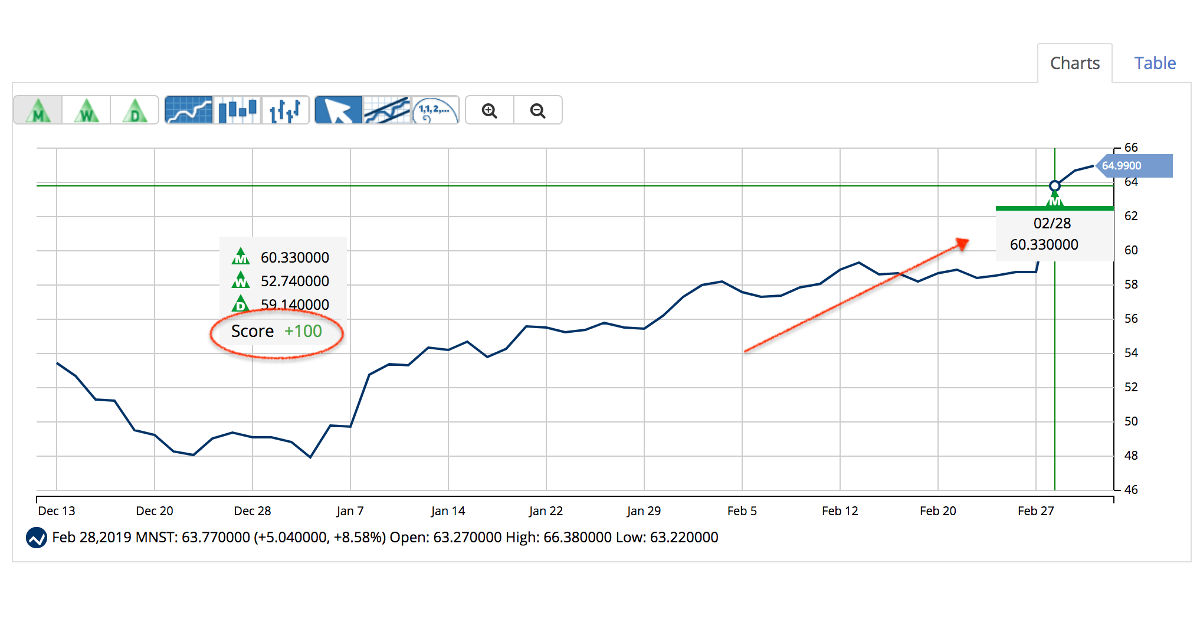
Momentum is one of the most powerful forces in the stock market. Once a trend has started, whether it’s buying or selling activity, it tends to keep happening at an accelerated rate until it reaches a market equilibrium. In the case of one brand-name beverage maker, the bullish momentum is boosting its stock price to…

When you think of a defensive stock, a technology company is probably the last place you’d go. Traditionally, the technology sector has been home to aggressive growth stocks with high earnings, and large swings in volatility. But as technology becomes more essential for everyday business, tech companies start to change into a more defensive economic…
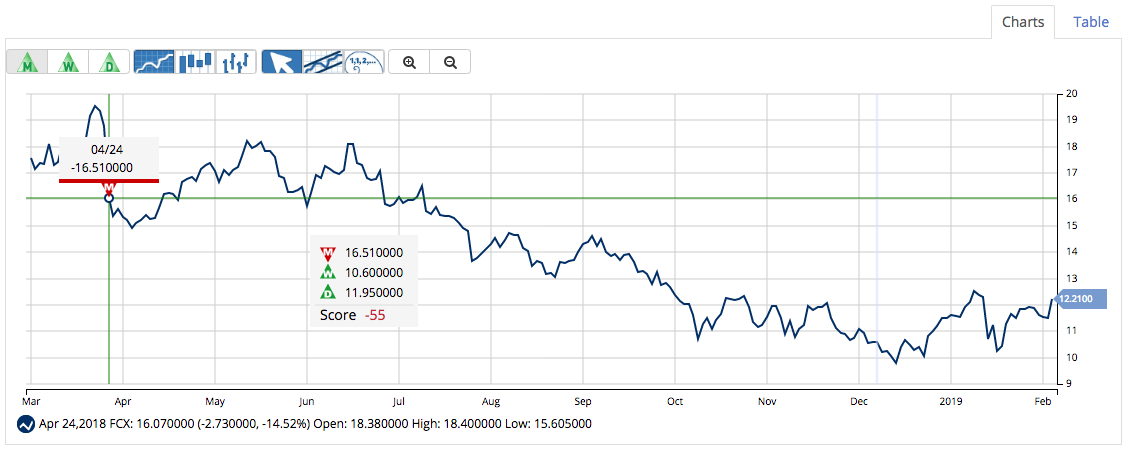
It may be counter-intuitive to declare a stock near its 52-week low as an opportunity, but some of the best value stocks are found this way. But having a low stock price alone isn’t enough of a reason to buy – it needs to have the right combination of technical and fundamental signals to tell…
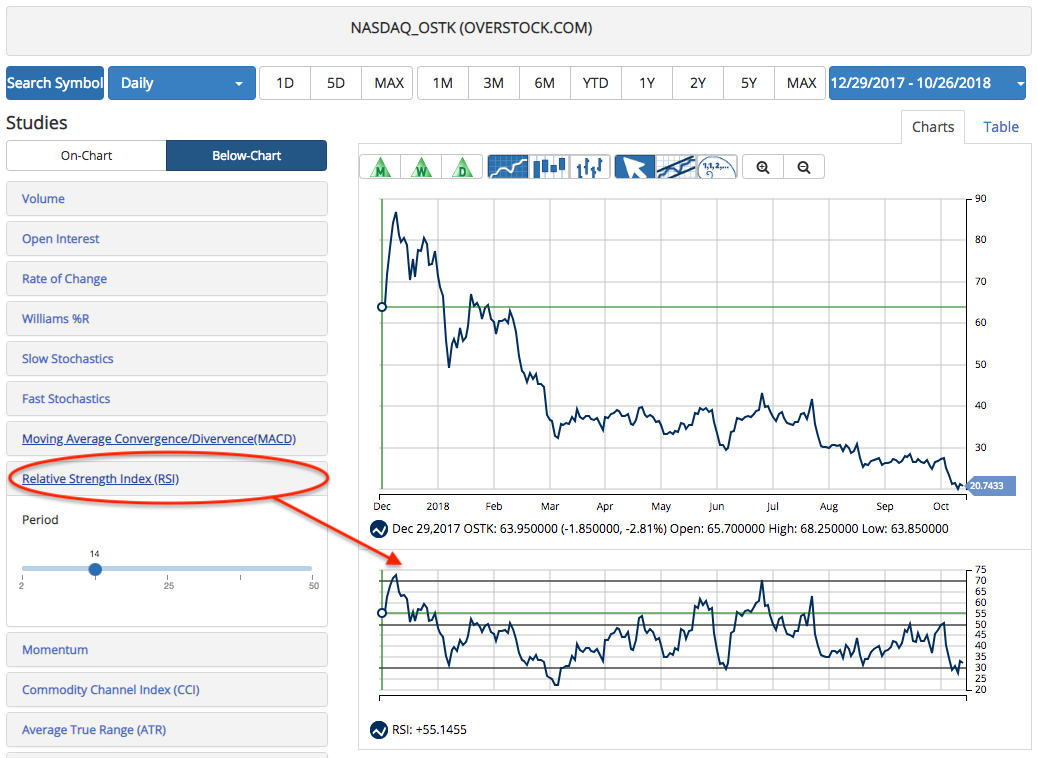
Relative Strength Index (RSI) is widely-used momentum oscillator measures the strength and speed of a market’s price movement by comparing the current price of the security against its past performance. Developed by J. Welles Wilder in the 1970s, the RSI can be used to identify overbought and oversold areas, support and resistance levels, and potential…
